For the past decade, it’s always been our mission to empower visual content creators, whether it’s for a school presentation or promoting your first business webinar.
With the COVID-19 pandemic accelerating trends and transformation that have been underway for decades, screen time is up across all ages.
Companies big and small are starting to be more flexible with their work arrangements. Students and teachers are taking classroom interactions and lessons online. Not to mention that more people are now building their online businesses — from eCommerce stores to consulting agencies.
And then there’s the spike in video creation and usage across the board.
For example, in our survey of 300 business professionals about their video creation efforts, 85.7% of respondents agree that video is now more important than other forms of content. Half of the respondents are also starting to create and develop more video content.
In short, today’s content creators need access to an all-in-one visual content creation platform to communicate their ideas, insights, and stories.
As we move forward with these new insights and findings, we are excited to announce the expanded and dramatically upgraded Piktochart!
Here’s a summary of the changes:
- From now on, you can create presentations, infographics, posters, flyers, charts, and VIDEOS using one platform. Piktostory, a product we used to offer separately, is now Piktochart Video.
- The old Piktochart is now called Piktochart Visual. You can easily switch between Piktochart Video and Piktochart Visual from your new dashboard. You’ll notice a new look and feel as you log in to your account (and make your way to our website too!)
- There are new templates, icons, and illustrations added to Piktochart Visual. This means you will have more options in visualizing your idea, information, and data.
- Finally, level up your visualization chops for data and processes with the addition of visualized numbers, diagrams for lists, checklists and forms, buttons, and hierarchy.
Keep scrolling for details of these updates or click on a link below to jump to a specific section:
Experience the power of a video editor, screen recorder, and video cropper with Piktochart Video
Piktochart Video (formerly Piktostory) is now LIVE on Piktochart!
Piktochart Video is a simple video editor and screen recorder. The possibilities are endless— crop your videos for social media, convert your videos to text, edit lengthy Zoom recordings, or communicate with your team using asynchronous video.
Pro customers will be granted 90 transcription minutes per user per month as part of their plan.
Meanwhile, free accounts will enjoy 20 transcription minutes because we want to give everyone a chance to try the new video editor.
You can access Piktochart Video directly in your Piktochart dashboard, as illustrated below.
Here are some of the wonderful things you can do with Piktochart Video:
1. Get your message across anytime and anywhere with transcribed videos
Record a brief update for your team, client, or followers. Capture your screen and troubleshoot or explain a concept. Walk your audience through presentations, infographics, or reports effortlessly.
2. Spend less time and effort on editing
With Piktochart, video editing is as quick and straightforward as editing text. Cut your video into shorter clips by highlighting parts of the transcript. Add titles or images. Upload intro and outro. Now, you can create a professionally-looking video in a matter of minutes.
3. Automatically add captions in over 60 languages
Piktochart Video automatically transcribes and adds subtitles to your videos, so you don’t have to worry about adding subtitles later in the process.
Choose the language of your video. Easily cut out any filler words by editing the transcript. Share your video with captions or export subtitles as .srt, .vtt, or .txt file.
4. Easily repurpose existing video content on social media
Don’t let that fantastic webinar, Zoom presentation, or virtual event waste its potential. Drive more awareness, engagement, and conversions by repurposing one video into multiple content pieces.
Automatically crop your videos with Piktochart Video to optimize them for Instagram, LinkedIn, Facebook, and other social media platforms.
5. Make your brand stand out with video
There is no better way to grow your brand online than with video. With Piktochart, you can easily ensure that your videos have a unique and recognizable style. Add your logo, match the video background to your brand colors, and more!
Ready to give Piktochart Video a try?
Repurpose your videos into multiple bite-sized video clips easily in three simple steps.
You can also watch the handy video tutorial below on how to create your first video clip in Piktochart Video.
Step 1: Upload or import your video
To add your video, you can choose from the following options:
- Directly record from your webcam (including screen casting)
- Upload a video file from your computer
- Import from your Google Drive
- Import a Zoom recording
Learn more about adding or importing your video: How to upload or import videos in Piktochart Video
Step 2: Edit your video
You should see your uploaded video under the Projects panel.
Click to select your Project and you will see that your video has been transcribed.
Now, edit your transcript by clicking on the text panel on the left and edit the text, similar to how you would edit a text document.
You would see that your video captions be updated immediately from the preview on the right.
Step 3: Export your video
You can choose to either export your video as a whole project or short bite-sized clips!
If you want to export your video as a whole, simply click on the Export button on the top panel. You will be asked to name your project.
If you want to export a short clip of your video, select a portion of your transcript and highlight it with your cursor. Once done, click on the Export button.

Once exported, you will find the exported clip under the Clips panel on your Dashboard.
You can download your video clips to your computer or share them directly to your social media pages for everyone to view.
Turn data-heavy content into a visual that gets people’s attention right away with Piktochart Visual
Piktochart Visual is your go-to tool if you want to make beautiful infographics, reports, presentations, and prints in minutes. No design skills required.
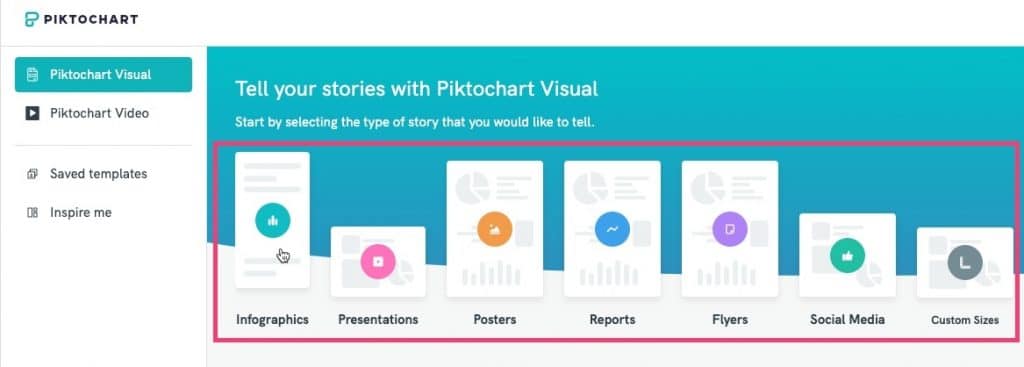
Choose your own visual content adventure by clicking on your preferred visual format in the dashboard — infographics, presentations, posters, reports, flyers, social media posts, or your preferred sizing.
You’ll also find hot-off-the-press templates, icons, and illustrations added to Piktochart Visual.
Plus, you have more options to visualize data and processes with the addition of the following:
- Visualized numbers
- Diagrams for lists
- Checklists and forms
- CTA buttons
- Hierarchy (in photoframes)
Piktochart Visual lets you:
1. Speed up your design process
Outsourcing graphic design is great, but having to wait on a deliverable when you’re on a tight deadline is frustrating.
With Piktochart Visual, you’re no longer dependent on a graphic designer to create reports, posters, infographics, presentations, and more. It’s like having your own professional designer 24/7.
2. Get access to templates created by seasoned communication designers
The templates are made by experienced designers who have worked for businesses across niches and industries. This means they know and understand the underlying principles of business communication.
For example, they already know the best colors and fonts for a specific industry or particular format.
In short, there’s no need for you to do some deep-dive research (and waste precious time) because it’s all been taken care of in the templates.
3. Customize your content to your brand
Want your brand colors in your visual content? No problem!
With Piktochart Visual Pro, you get access to Brand Assets. Upload your logo and Piktochart will automatically upload your brand colors for you. You can then use these brand colors every time you create your brand visuals.
4. Integrate Piktochart Visual into your current workflow hassle-free
With Piktochart Visual, you don’t have to overhaul your entire design workflow.
Download your visual content in PNG and PDF formats and share them with your colleagues via email. You can also download your presentations as a PPT file and use Powerpoint to present.
5. Turn complex data into a clear, catchy visual that everyone can understand
Data doesn’t have to be boring.
Copy-paste your data into our graph maker, upload a CSV , Excel file, or link up a Google sheet and turn complex data into a clear graphic that gets your message across.
Choose between different types of charts & graphs to present your data in a clear and understandable way.
How to navigate the new Piktochart Visual dashboard
The dashboard houses all your work. From here, you may view and manage all your saved visuals and choose the template format you’d like to use. The video tutorial below shows you how.
How to manage your workspace in Piktochart Visual
Every visual you create on Piktochart takes place in a workspace. It’s where you store your visuals and organize information — as just one person or collaborate as a team. The video tutorial below shows you how.
Frequently asked questions about your upgraded Piktochart experience
Got questions about your upgraded Piktochart experience? We’ve got answers below!
1. How can I access Piktochart Video as an existing Piktochart user?
You can easily access Piktochart Video by logging in to your Piktochart account.
Once you can see your Piktochart Dashboard, you will see two tabs on the left panel: Piktochart Visual and Piktochart Video. Click on the Piktochart Video tab to start working with the video editor.
2. How does this change impact my subscription as a paid account holder for Piktostory?
Your Piktostory subscription and quota will remain the same until December 2022.
Afterward, depending on your billing cycle, you will be either charged $29/month (monthly billing) or $228/year (annual billing).
You can still access all your saved projects and clips by simply navigating to Piktochart Video in the Piktochart Dashboard.
3. How does this change impact my subscription as an existing Piktochart Pro account holder?
Nothing changes until July. However, from July 4, 2022, the Piktochart Pro subscription price will increase.
For customers on the annual plan, the price will increase from $168 to $228 per member per year. You will be charged $228 on your next billing date.
For Piktochart Pro customers on the monthly plan, the price will increase from $24 to $29 per member per month. You will be charged $29 on your next billing date in July or August.
4. How do I access my Piktochart account settings in the new dashboard?
You can access all your account settings, contact our support team, and manage your account members by clicking on the profile icon in the top-right corner of your new dashboard.
Level up your visual content creation with Piktochart Video plus Visuals
Try Piktochart for free and get the best of both worlds (visuals + video!).
PS. We just kicked off a new space for avid Piktochart fans to connect with each other, learn new skills in design and storytelling, and share what they want to see next from Piktochart. We aren’t quite ready to share all about it just yet, but if you’d like early access, head on over to our Community page.
