Most online tools have their little quirks and hacks that you typically find in one of two ways: either by accident, after hours spent in the tool; or because someone told you where to look and what to look for.
Piktochart is no different. Even after working here for almost two years, I still have those a-ha! moments now and then. I rush to tell people about it, only to find out my hidden secret has been out there for a while.
Whether you’re using it for infographic design, slide design, poster maker, or as a report maker, we’re here to reveal some things you might not know about Piktochart. We wanted to show you some of our favorite Piktochart hacks to save you some time and spice things up. We’ve even separated the tips into sections (Beginner, Intermediate, and Advanced) to make sure there’s a little something for everyone.
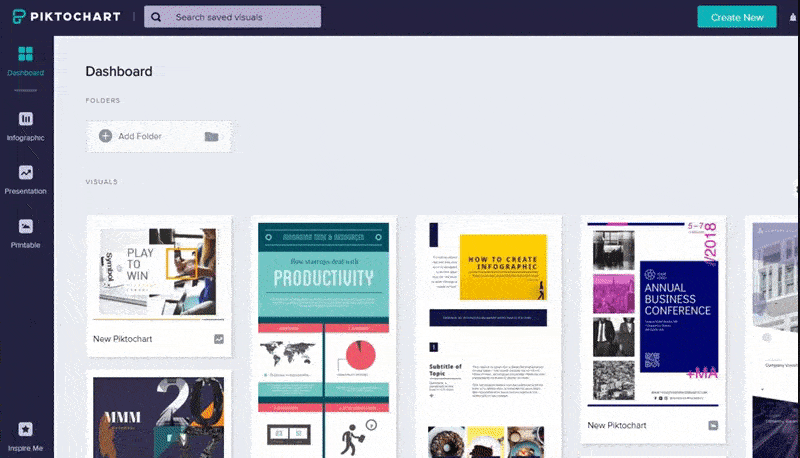
If you are not using Piktochart yet, you can sign up for a free account here. The online tool makes it easy to create visuals (infographics, presentations, brochures, posters, flyers, and social media graphics) without being a graphic designer. To have it even easier, choose one of the design templates from the gallery and customize it.
BEGINNER
1. Bring Life to Your Presentations
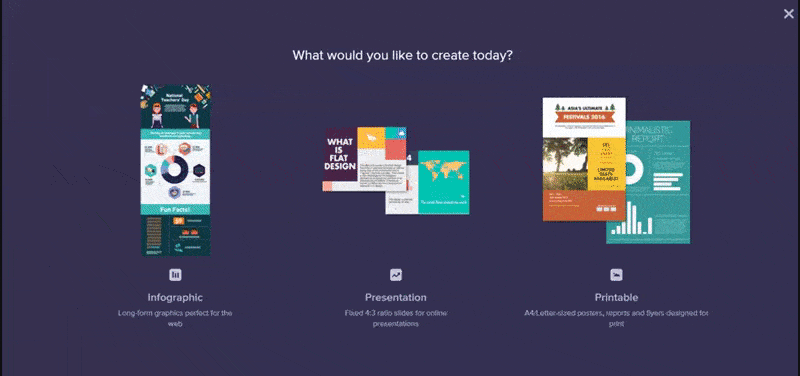
Did you know you can also create presentations in Piktochart? From your account, go to Pikto Templates and choose the Presentation format. Choose your new favorite presentation template and customize it! When you’re done, click Publish! There are more privacy and sharing options available for PRO users, too!
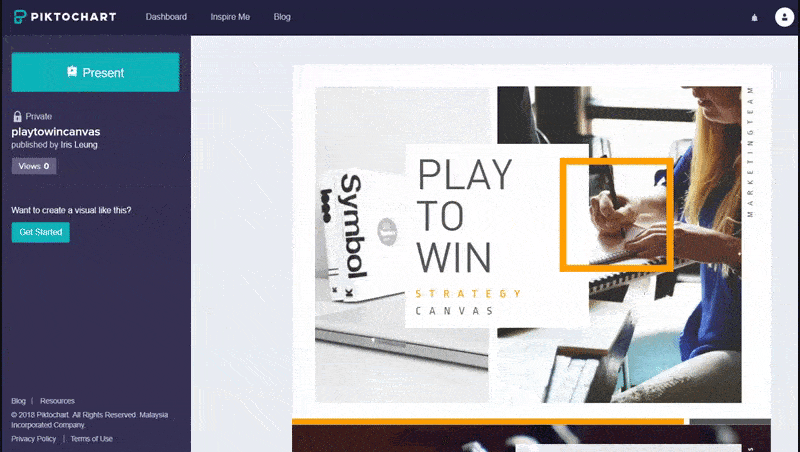
What’s an even cooler Piktochart hack is that the presentation mode has different transitions. After publishing and then clicking on Present, you can choose your preferred transition from the five different options you see below:
2. Keep It Proportional
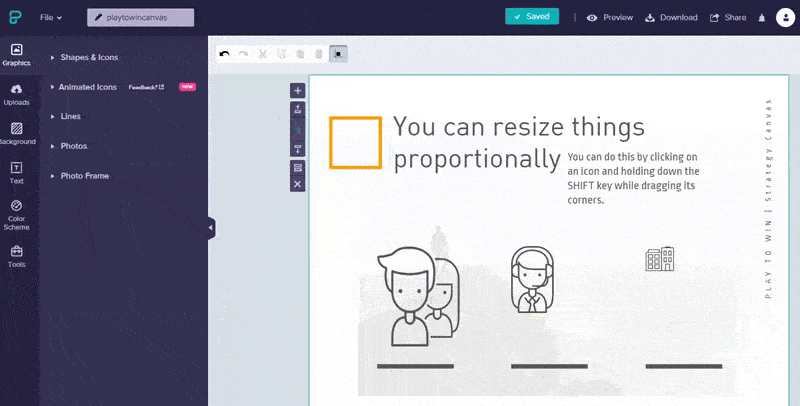
This Piktochart hack is particularly useful when you want to change the size of an element (photos, icons, text frames) without changing its proportion. No one likes unnaturally stretched photos. By holding down the SHIFT key while dragging your element’s corner, you can resize it proportionally:
3. Group Your Elements
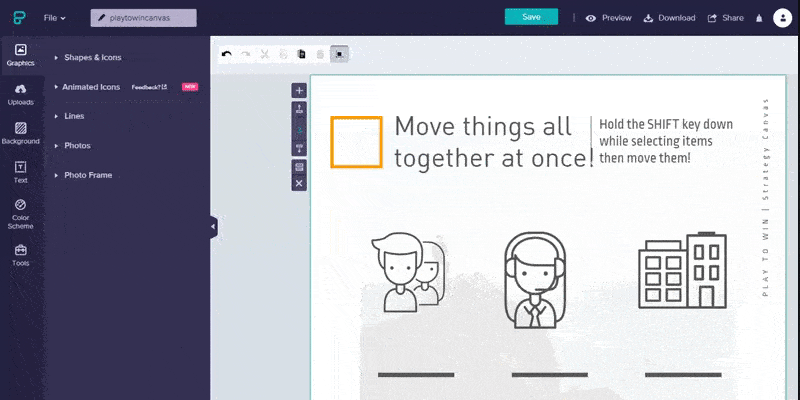
Want to move your elements quickly? No need to do it one by one. Just hold the SHIFT key while you select the multiple elements, and you can move them together.
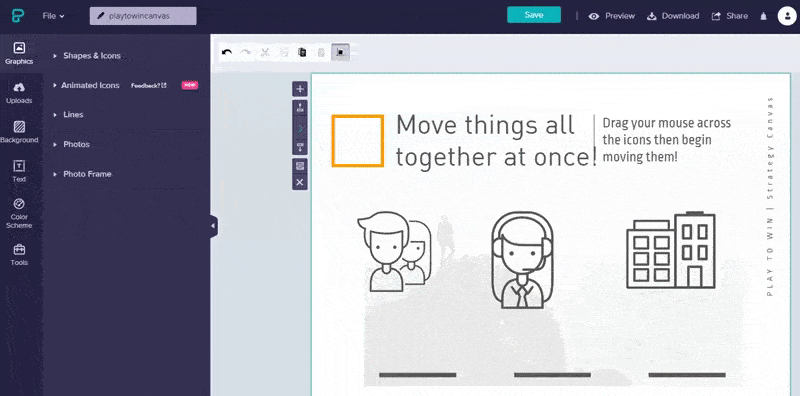
Better yet, select them all at once by clicking and dragging to select the area they are in.
4. Copy From One Tab to Another
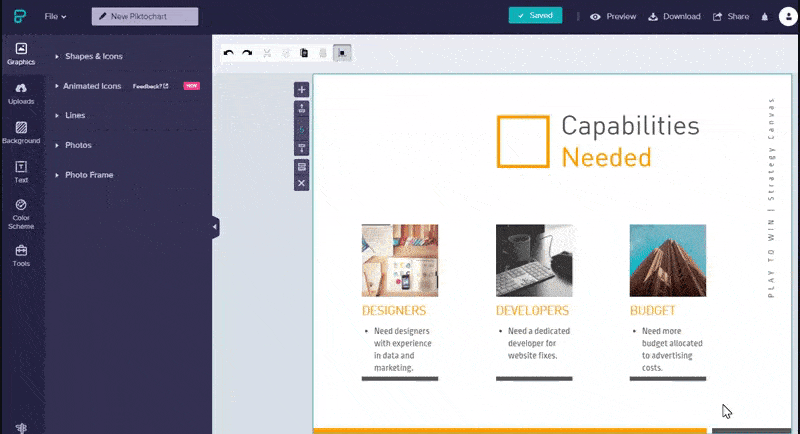
Let’s say you’ve created a bunch of awesome infographics, and you’re working on adding to your collection. If you’d like to reuse some of your previously designed elements, you can perform what our co-founder Andrea likes to call COPY-PASTA (yes, he is Italian!).
Simply open Piktochart in two different tabs, select the areas you’d like to duplicate in the original tab, and then copy and paste them into a different tab. You can stitch together a whole new infographic this way. Just remember to be consistent and use the same style. Try to do without merging multiple templates and styles together. Simplicity first!
5. Find Answers Directly in the App
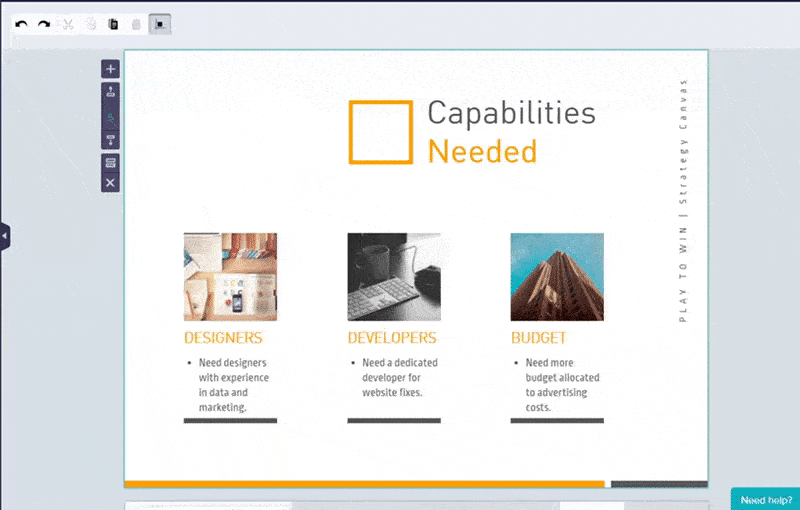
Do you have questions about how to use Piktochart? Our tip is that you can navigate directly to our FAQs straight from the presentation editor. Just click on the “Need help?” button in the bottom right corner and type in your question. All the relevant queries will appear along with answers.
6. Look for Inspiration in the Featured Gallery
Our featured gallery is the perfect place to go when you find yourself looking for inspiration. There you can see what other users have created using our templates. We hope it gives you some ideas!
7. Drag to Upload Images From Your Desktop or Downloads
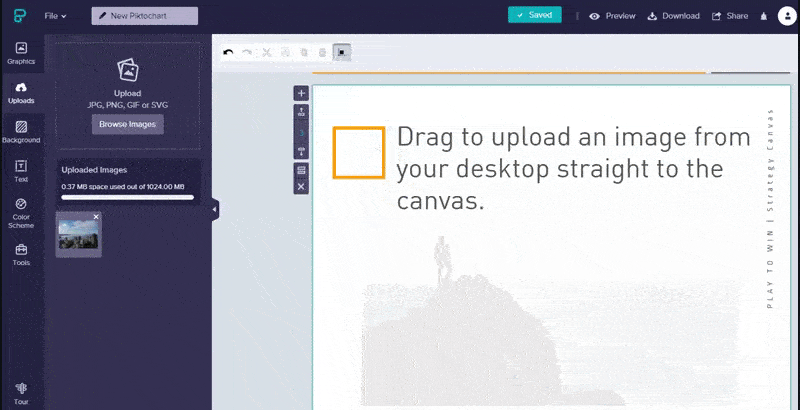
In case you were wondering, there’s a much faster way of adding images to Piktochart than going to Uploads → “Select Image(s) from your computer”. You can simply drag and drop images from your desktop, download bar/window, or folder directly to the canvas.
8. Take Your Presentation Offline
In case you need your presentation slides to be available offline, and you don’t want to publish your project, you can always download your presentation or infographic as PDF blocks. This allows you to present it in your meeting and send your slide deck to your colleagues or classmates.
INTERMEDIATE
9. Create Iconic Charts
Behind adding GIFs, this is my second favorite Piktochart hack. You can spice up your chart by personalizing it with icons.
Say you need to create a chart about trees being planted this year by your organization. Instead of a pie chart, you can make a tree chart! I mean, you’re not planting pies, right?
Simply double click on your chart, select Icon Matrix as your chart type, then go to Settings and select your preferred shape. You can choose a basic shape like a heart or a dot, or you can browse through our icon library for more options!
10. Add More Space
This tip works best if you’re experiencing an information overload or just need more white space around your elements. Remember, white space doesn’t actually need to be white.
First, select your block, then click the settings icon to increase your block’s height. Now you’ve got much more space to breathe!
Worth noting is that only infographics and printables have the resizing option, and you’ll only be able to add more height to your visuals—not width.
11. Add Filters to Your Images
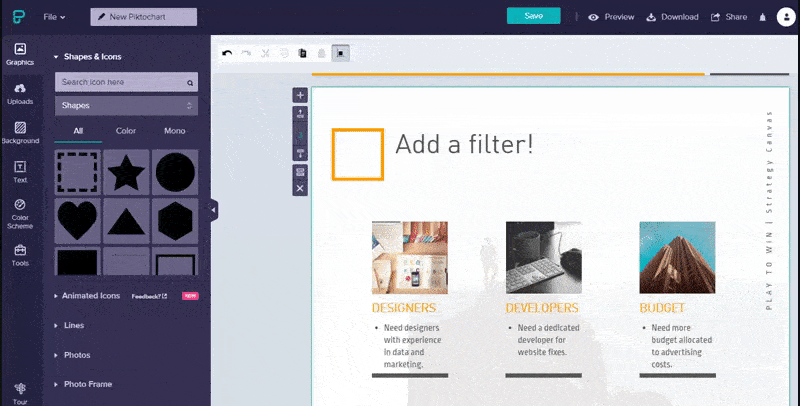
We’re currently working on a new image filter feature. For now, you can make your own by adding a dark grey block on top of an image and then reducing the block’s opacity. It makes a great background for presentation slides that won’t blind your audience!
12. Be Consistent With Colors
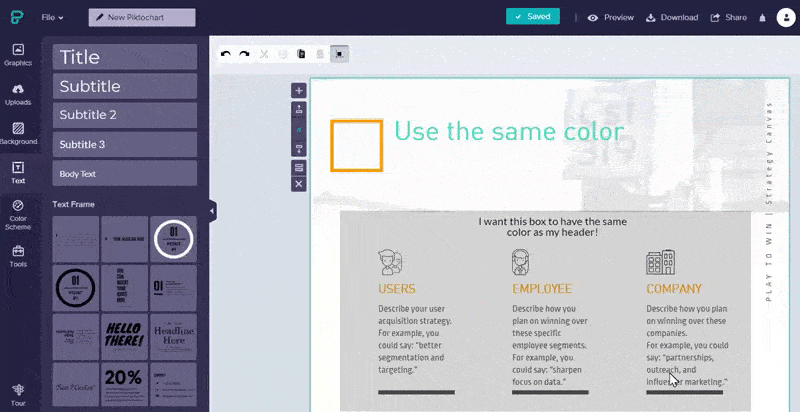
If you create a new shape or insert a new text box, you’ll probably want to match its color to an existing element. If that’s the case, just select an existing element, click on its color in the upper toolbox, and copy the HEX code next to it.
Now you can click on your newly created element and paste the code in the same place. This is a great Piktochart hack to ensure color consistency throughout your infographic.
If you know your brand colors, find out what their HEX codes are and use them throughout your visuals to truly make them your own.
You can also learn more about the psychology of color in our free online course, Fundamantals of Visual Storytelling.
ADVANCED
13. Change the Shape of Your Photos
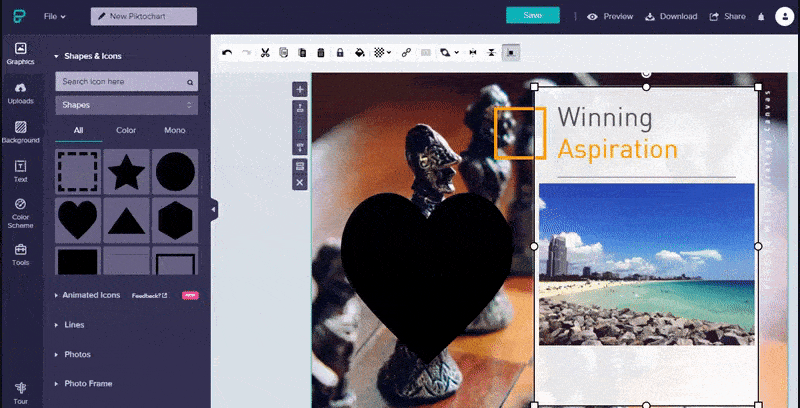
Want to make your photos into different shapes? You can do that by inserting and selecting your desired shape (for example, a heart) and your photo. Click on the masking option on the toolbar, and you will make your photo heart-shaped. Double-click on your new image, and you can resize, re-center the image in the mask, and move the image around. Pretty useful!
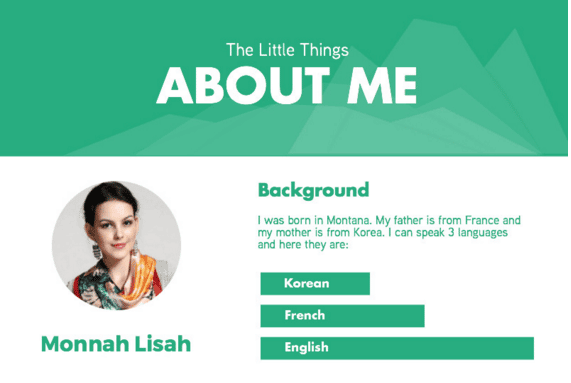
This Piktochart hack can be extra useful in documents like resumes or sales reports where you might want to make your photo into a different shape (like the circle image in our About Me template below):
14. Build Mockups for Landing Pages
If you’re a marketer working closely with designers and would like to show them your idea for a landing page, you can easily mock it up in Piktochart. Here’s an example of a new mockup I created for our designer to include a “Request a demo” button on our Pricing page:
I took a screenshot of our Pricing page, added it to a new block, and then extended that block to make room for some new additions. Then, I added another square to make the background, a new text box for the copy, and another box to simulate the “call to action” button.
Here’s a tip: To match your brand’s colors, determine the HEX codes and then use them to match colors and maintain consistency (see hack #15).
If you want to cover up existing design elements and add new ones on top, just add a square with the same color as your background, and there you go; you’ve hidden things.
15. Find More Icons by Refining Your Search
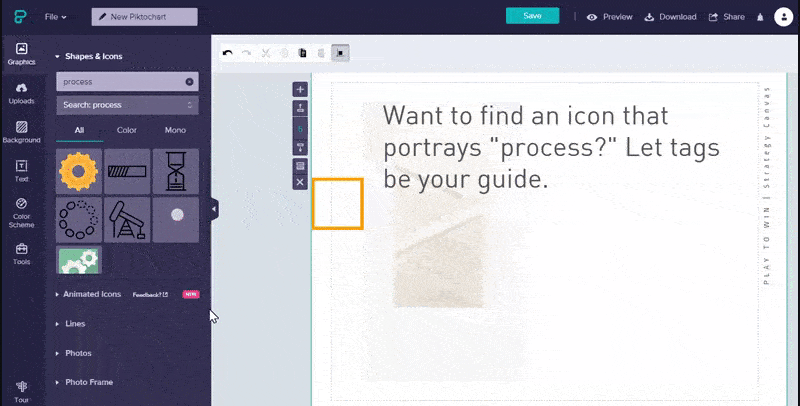
Sometimes, searching for a specific icon might not return the results you want. Instead, try searching for something similar. Once you’ve found something close, hover over the icon to see what tags were used to file and categorize it on our backend. Then, refine your search using those tags. You might find more options! Also, browsing through categories helps get ideas on how our icons are tagged!
In this example, I was searching for an icon to symbolize a process. I found something similar to what I wanted, and when I checked, I saw that it was tagged “mechanic”. Then, I searched using “mechanic” and found more options, but I still wasn’t satisfied. So, when I saw that the term “gears” was also used, I searched using “gears” and found what I was looking for!
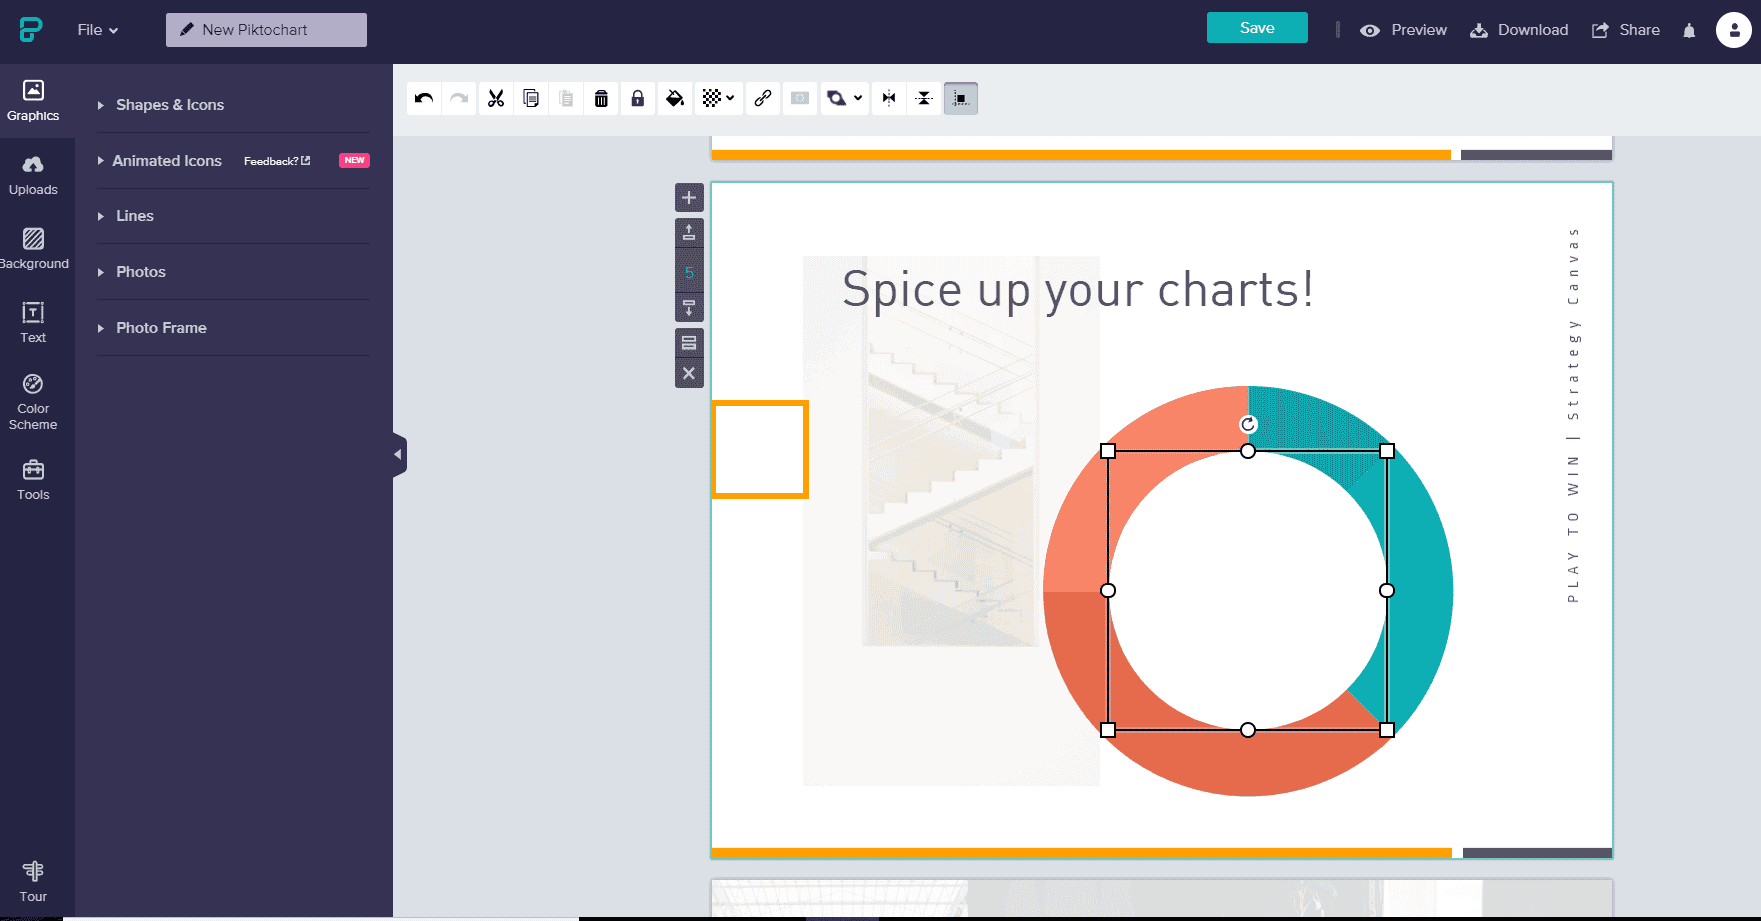
16. Spice Up Your Pie Charts
If you’re bored with simple pie charts, spice them up by adding shapes and making them the same color as your background.
We hope you’ve enjoyed our list of hacks! Which Piktochart hacks are you most excited to use? You must have some tricks of your own, too. Tell us about them in the comments below or tweet them to us!
