Online map maker to create a map or choropleth in minutes
Join over 11 million users who trust Piktochart to turn complex data into captivating maps. Our intuitive, platform helps you create visually stunning maps and charts in minutes – no design experience needed. Start from a professionally designed map template and easily customize it to your needs.
11 million people worldwide use Piktochart
Make a Map or Choropleth
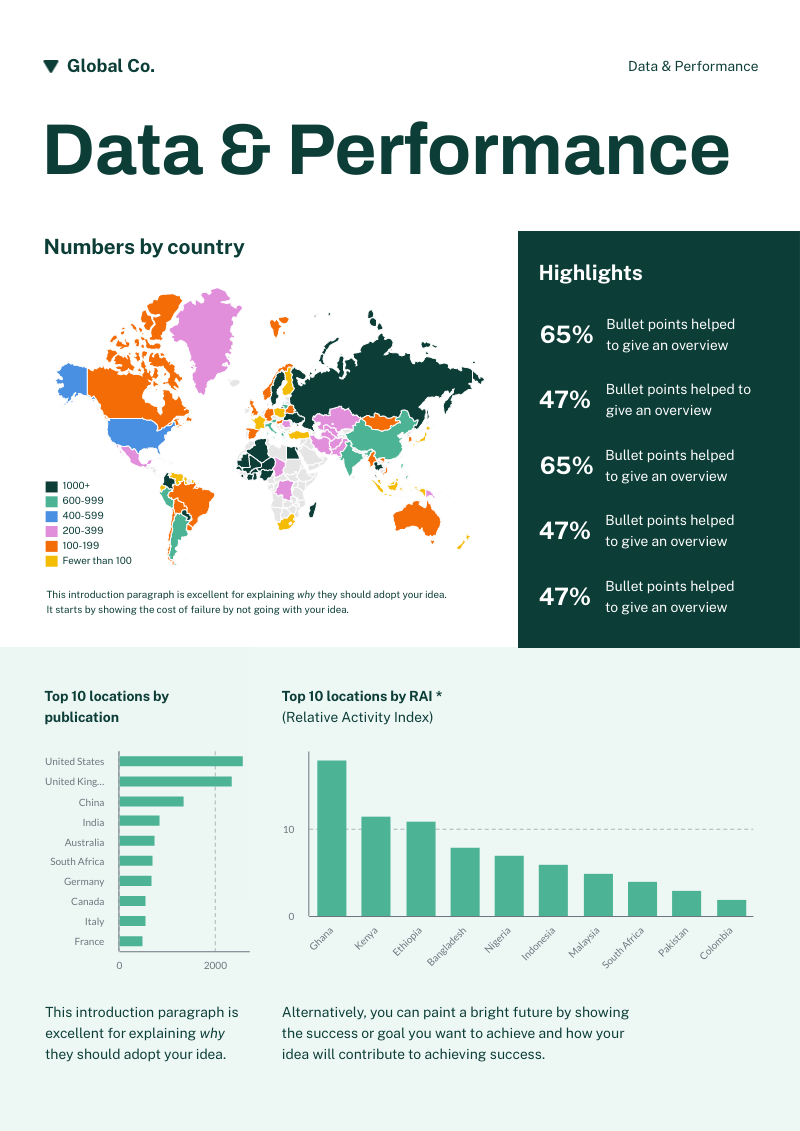
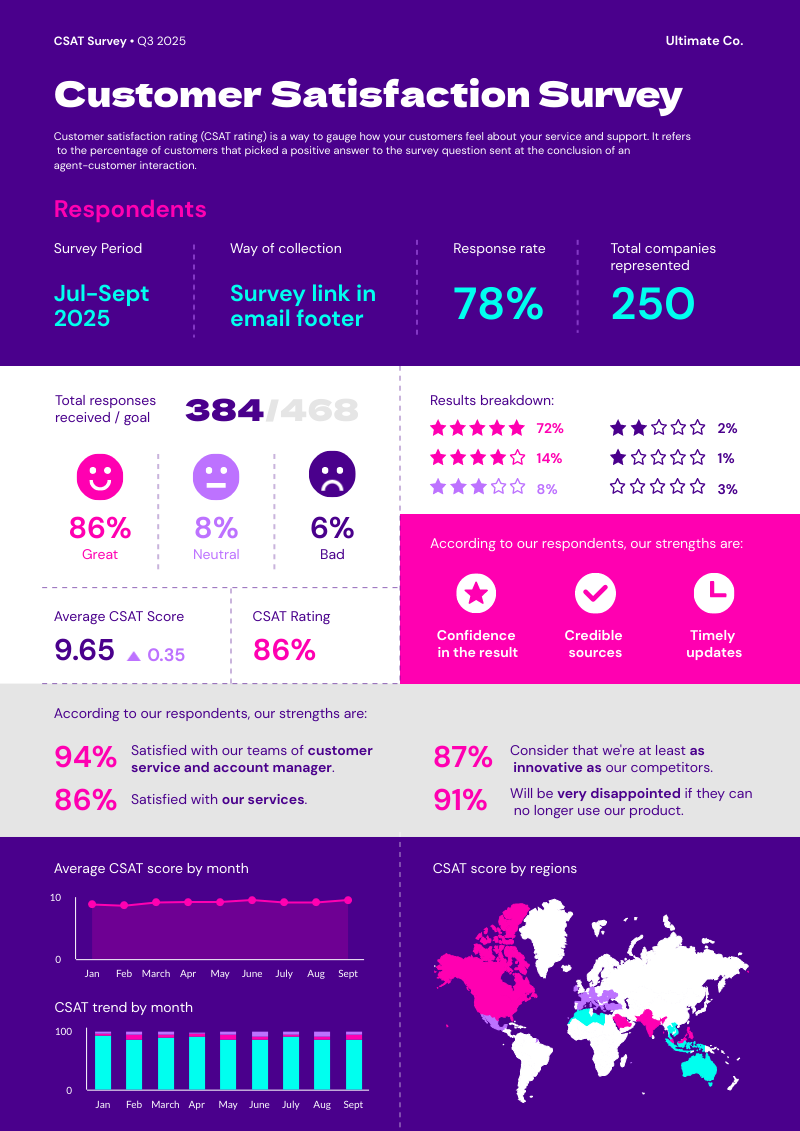
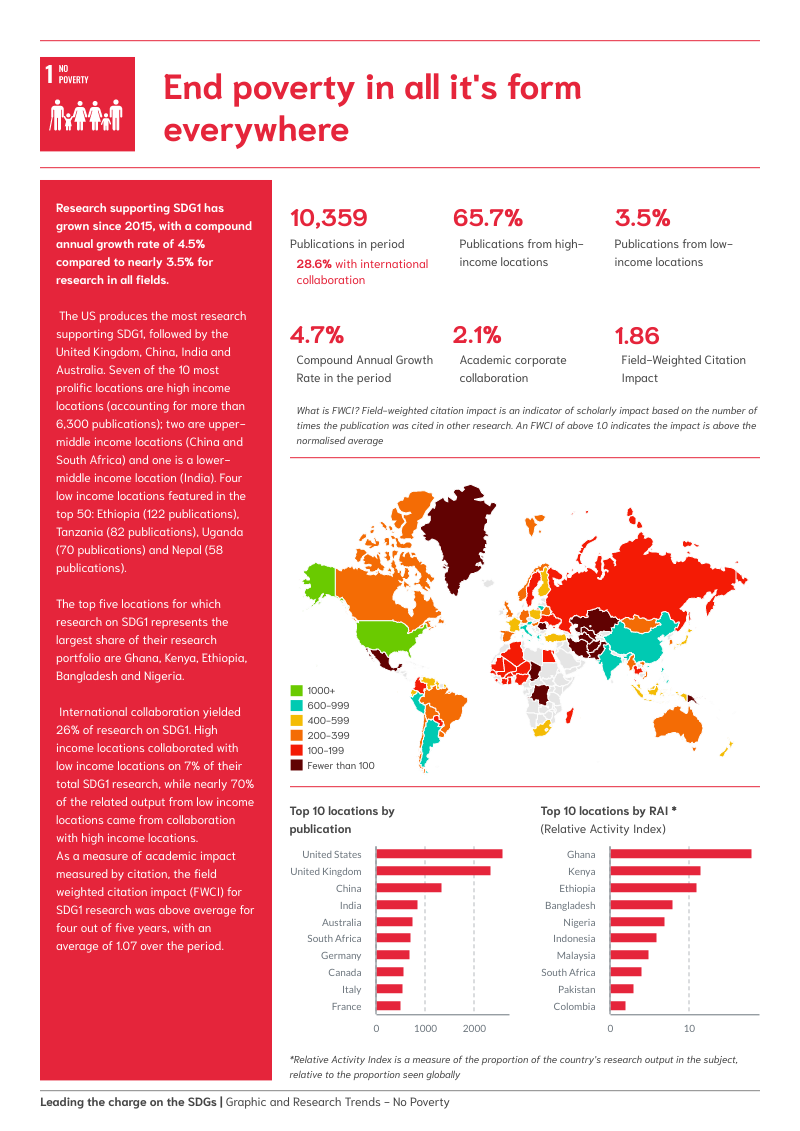
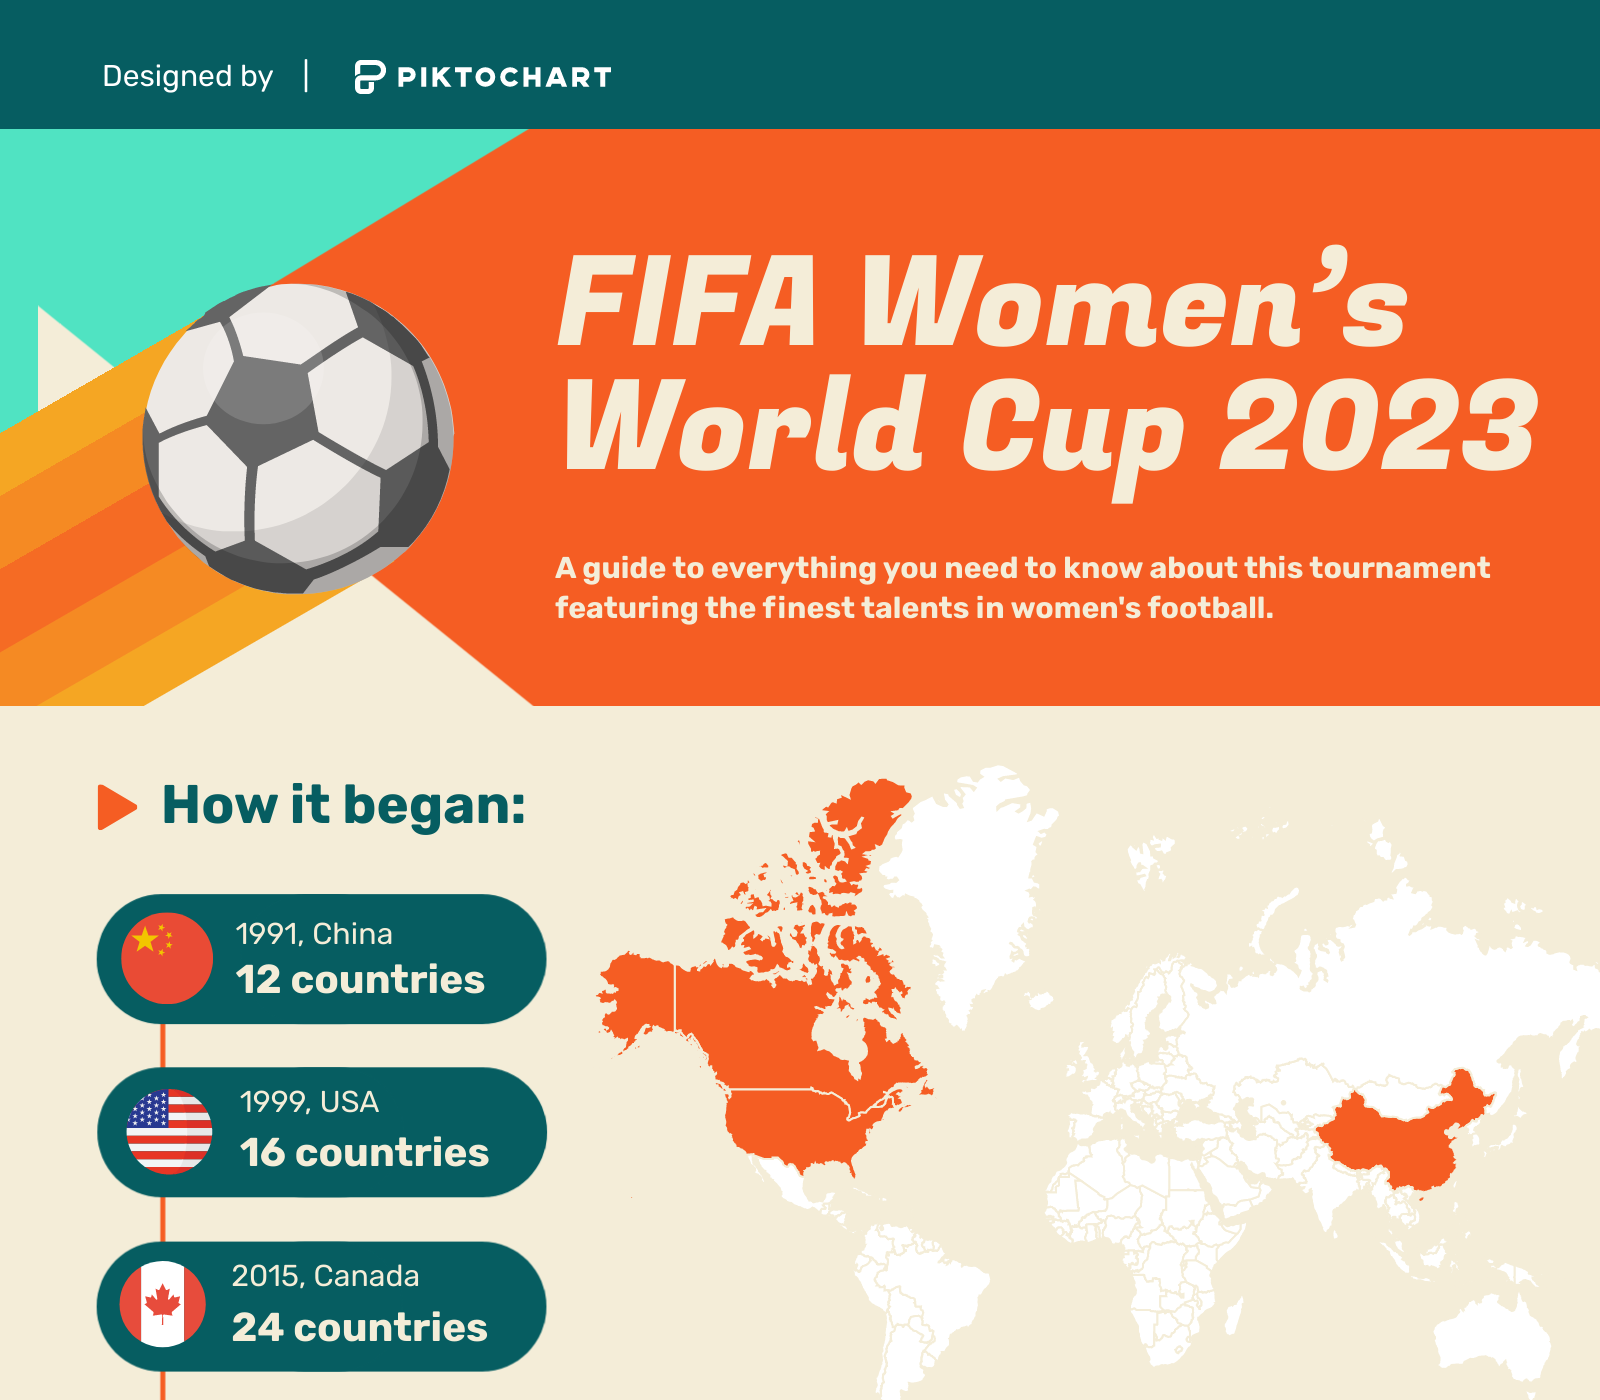
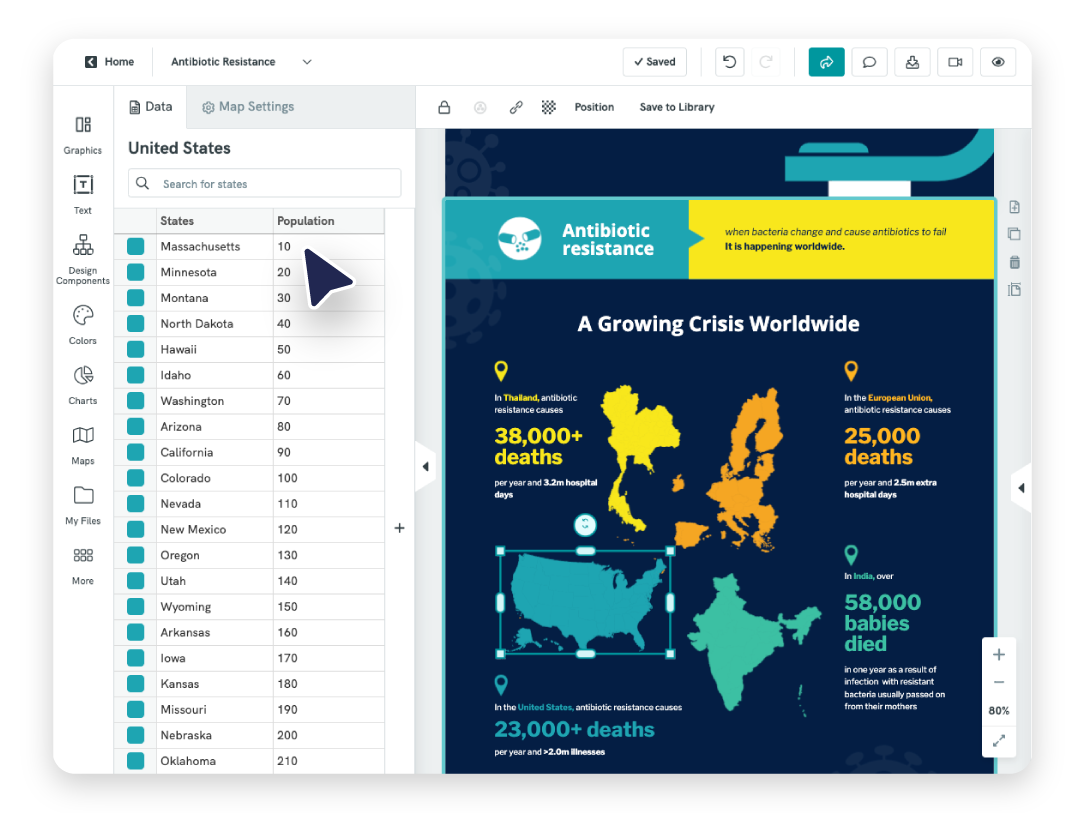
Piktochart transforms raw data into clear, impactful choropleth maps. With intuitive color mapping, your statistical data becomes a visual story, crafted quickly and effectively.
Create a free account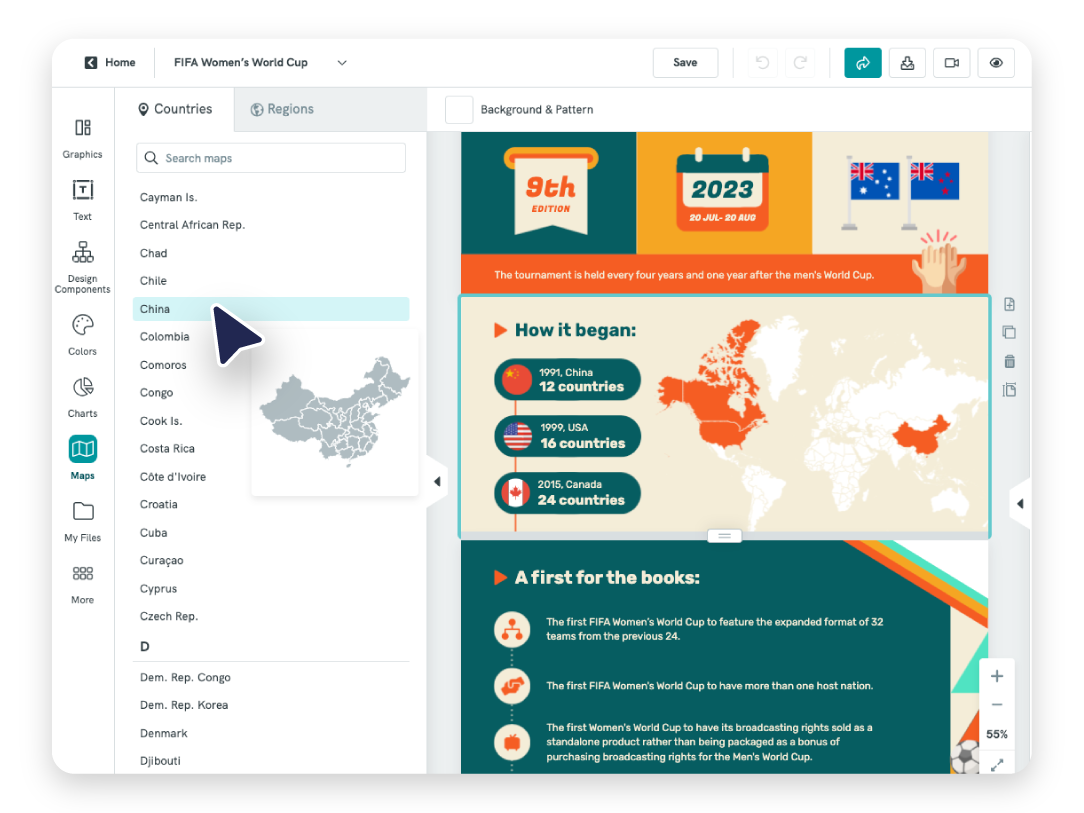
World, Continent and Country Maps
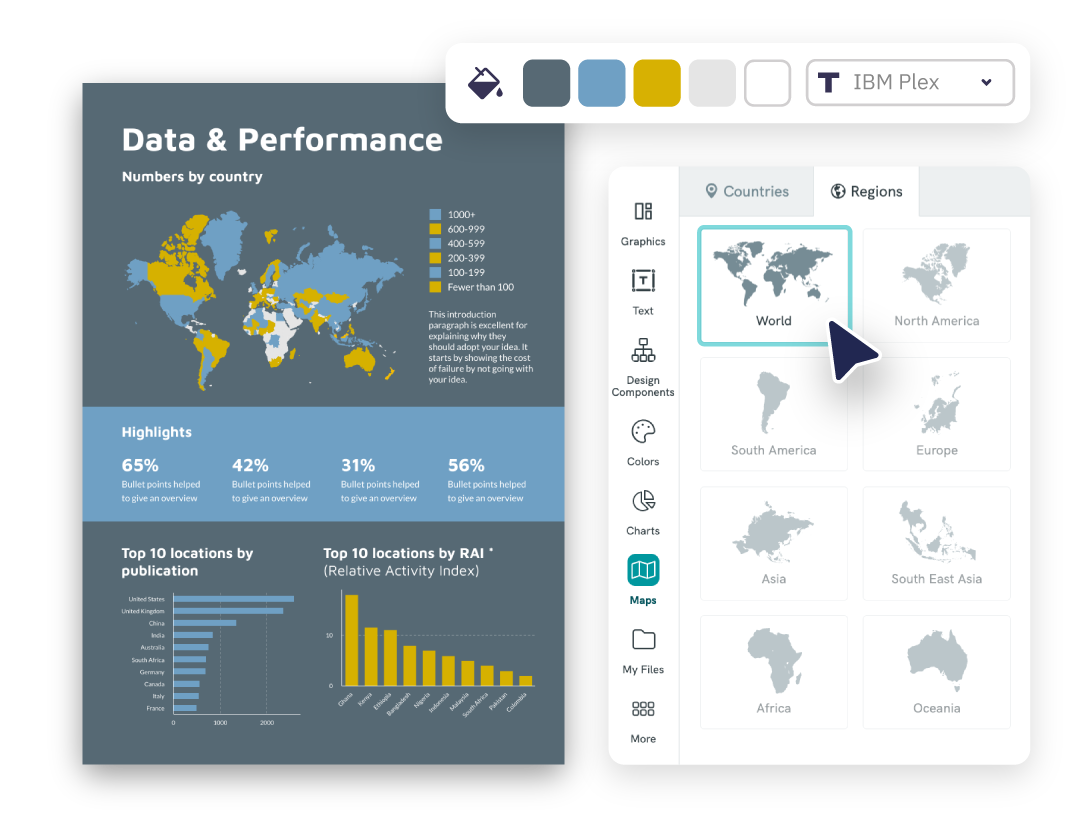
With Piktochart, access a world map, maps of 7 continents, and over 240 country maps to bring your data to life. Ideal for global to local data representation.
Explore Piktochart now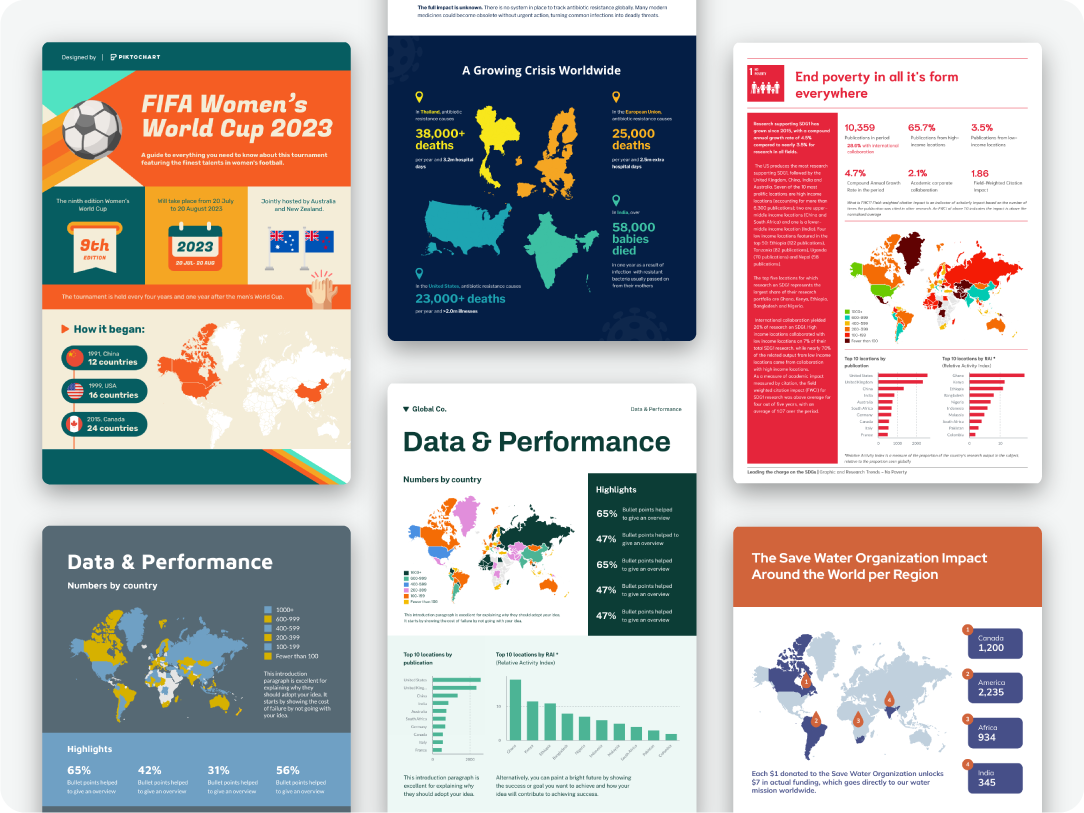
Content creation with free templates
Add Your Map to Any Format
Embed your own custom map into any format, enhancing reports, presentations, infographics, or dashboards. Seamlessly integrate for maximum impact and clarity, whatever your platform.
Try it nowTestimonials
“Piktochart is my go-to tool when I’m looking for a way to summarize data that is easy for our upper management to review. Piktochart provides me with the tools to display data in a creative, visually appealing way.”
“Piktochart has allowed me to change the style of my company’s communications. The campaigns are more visual, modern and attractive thanks to the templates that always serve as inspiration. Now even my colleagues use it! Piktochart helped me to engage, increase participation in events, add value to internal campaigns and to reinforce the culture and communication flow of my business.”
“As an HR Assistant, I have to find new and creative ways to engage our employees and effectively communicate across a large organization. Piktochart has tremendously helped me in achieving this.”
“Piktochart helps me translate often dry financial policies and accounting standards to easy to understand and concise one-pager visuals for management.”
How to Make a Map Online
1. Open Piktochart’s editor and click on the ‘Maps’ icons in the left panel. You’ll find two tabs at the top of the panel: choose between mapping countries or regions.
2. Once you’re in, you can directly add or modify your map data via the datasheet. We’ve made sure it’s straightforward to maintain consistency in your data types, making your map both accurate and visually striking.
3. Once your data’s ready, adjust map and outline colors, or turn your creation into an informative choropleth map.
4. Once your map is ready, share it with the world! Embed it on your website or blog without losing any of the rich details or annotations.
Use cases of Maps
Choropleth maps and other map visualizations have a wide range of use cases, particularly in areas where geographic data representation is essential:
1. Demographic Studies
Choropleth maps for detailed analysis of population patterns, age distributions, and other demographic metrics.
2. Public Health Analysis
Map disease hotspots, vaccination progress, and health statistics to inform public health strategies.
3. Environmental Studies
Visualize data on climate change, pollution, and environmental impacts with clear, informative maps.
4. Economic and Business Analysis
Analyze market trends, consumer behavior, and economic indicators geographically for strategic business insights.
5. Educational Purposes
Enhance learning by mapping historical events, cultural diversity, and language distributions.
6. Urban Planning and Infrastructure
Use population and area data to inform urban growth, resource distribution, and infrastructure development.
7. Election and Political Analysis
Illustrate voting patterns and political demographics for in-depth electoral and political analysis.
8. Agricultural Planning
Identify agricultural trends like crop distribution and soil types for improved planning and sustainability.
9. Tourism and Travel Industry
Showcase tourist attractions, accommodation density, and cultural sites for informed travel industry insights.
10. Games
Create detailed game worlds with choropleth fantasy maps, guiding players through immersive landscapes and strategic gameplay in both board and video games.
Ready to create maps or choropleths in minutes?
Join more than 11 million people who already use Piktochart’s free map maker.
