Get buy-in and funding with our online pitch deck creator
It’s time to ditch PowerPoint. You can easily create a professional-looking VC pitch deck, sales pitch, or product presentation with pitch deck templates from Piktochart.

Free pitch deck templates
Create a pitch deck in less than an hour
Creating a compelling sales pitch deck in PowerPoint requires getting some help from a designer to make it look professional. With Piktochart, you can whip up a professional-looking pitch deck in less than an hour — No training or graphic design experience required. Our drag and drop editor helps you create startup pitch deck, product presentation, or a sales deck in minutes, not hours. Start with one of the pitch deck templates designed by experts. Quickly get to a professionally-looking slide deck that will help you engage with your audience and drive the results you are looking for.
Create your pitch deckOnline and offline sharing
Present online, share via link, or download
Do you want to present your pitch deck during a video call or a virtual conference? Easily switch to presentation mode, and you are ready to go. You can also download your presentation in a .ppt or .pdf format and share it via email or present offline using PowerPoint. Want to see how many people saw your pitch deck? Share your presentation over a link and track the views inside of Piktochart.
Create your pitch deckBranding
Customize your pitch deck slides to your brand
Want your brand colors in your pitch deck? No problem! With Piktochart Pro, you get access to Brand Assets. Upload your logo and Piktochart will automatically generate your brand colors for you and apply them with one click to the selected pitch deck template. You can also upload your customer fonts to stay 100% on brand.
Learn more about Brand AssetsTurn complex data into a clear, catchy visual.
Data is the most important element of any pitch deck. With Piktochart’s pitch deck generator, visualizing data is easy. Copy-paste your data into our graph maker, upload a CSV, or Excel file, or link up a Google sheet. Turn complex data into a clear data visualization that gets you the buy-in you are looking for. Choose between charts, graphs, and interactive maps to present your data clearly and understandably.
Create your pitch deckHow to create a pitch deck
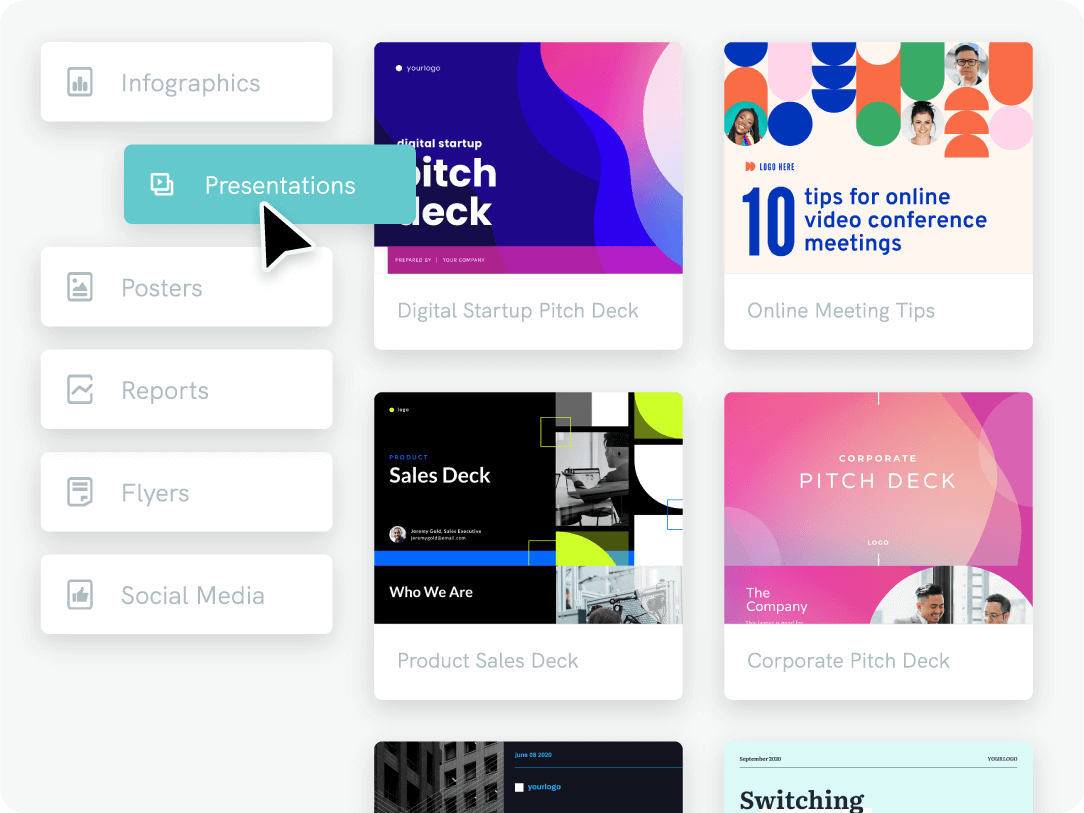
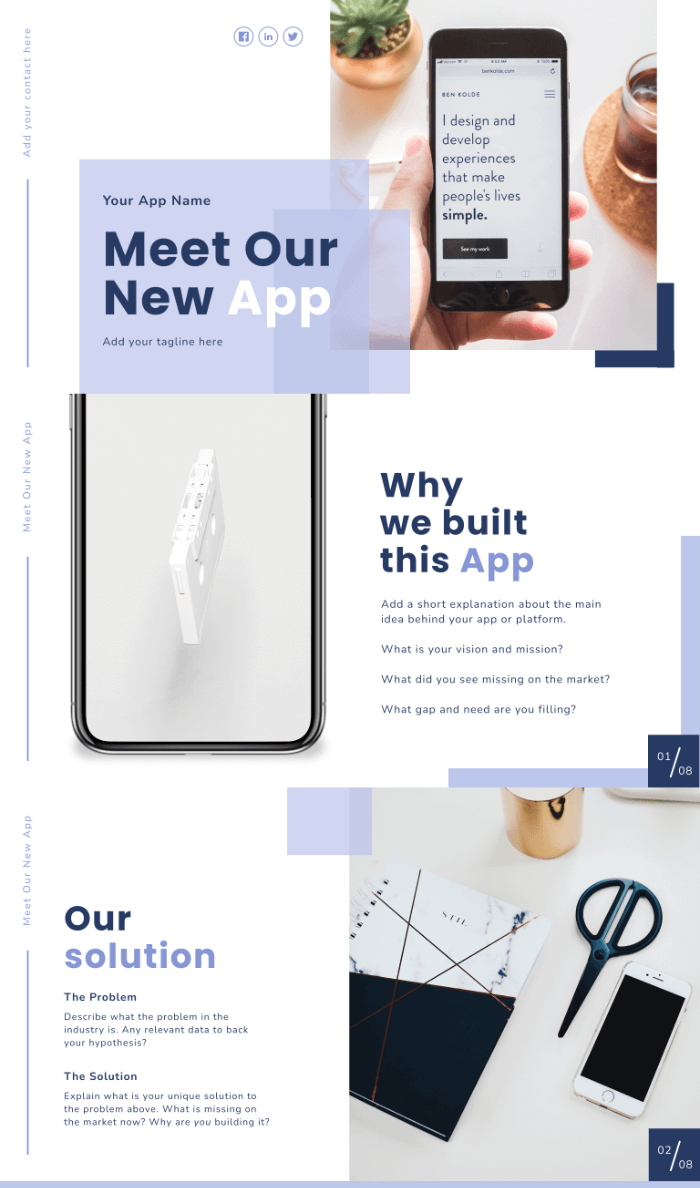
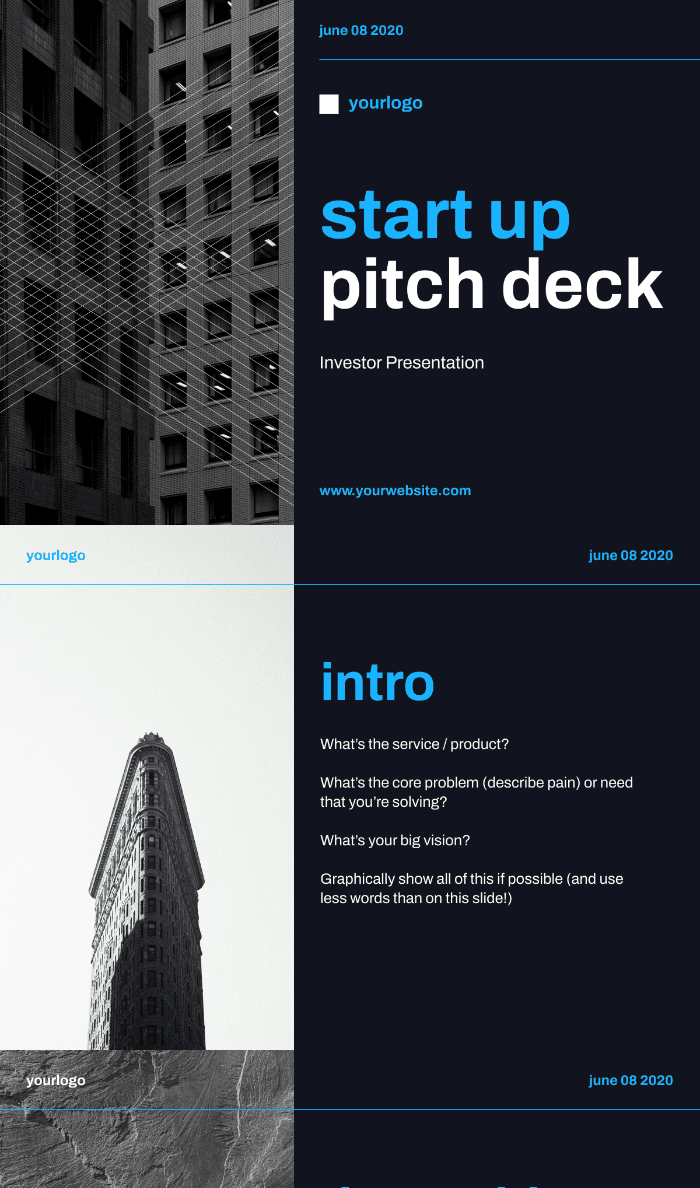
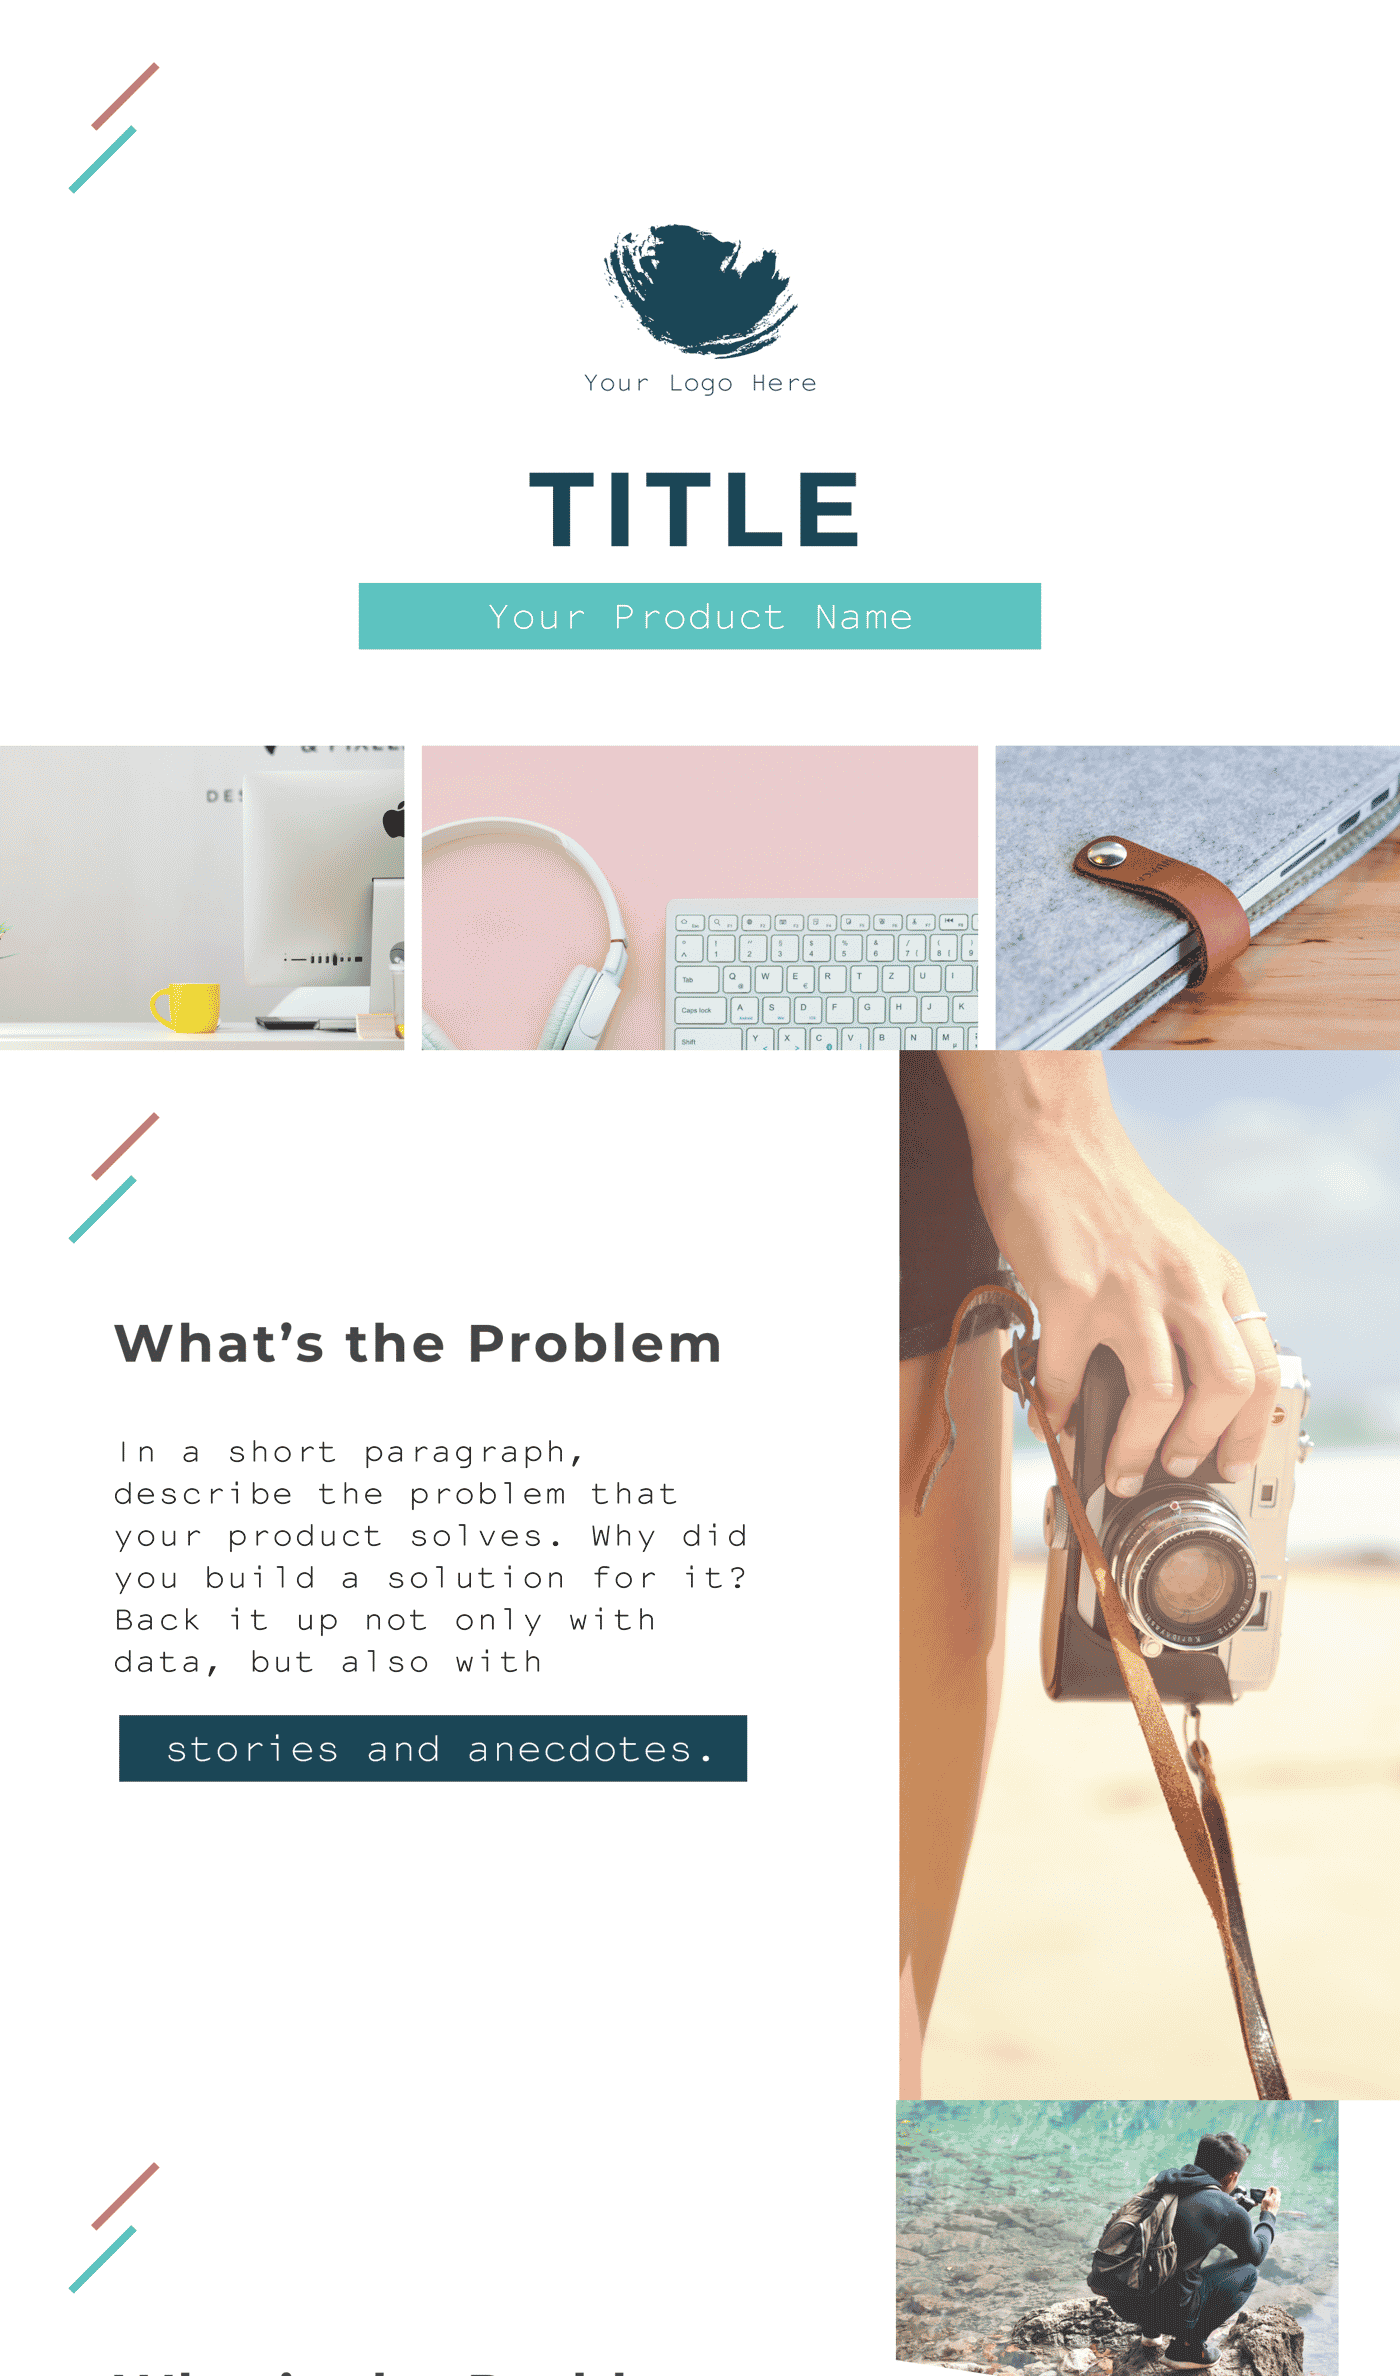
Unless you’re a professional designer and prefer to start with a blank canvas, pitch deck templates are the way to go. Our pitch deck templates are designer by experts to help you look professional while sharing your business ideas with clarity. Find one you like by using the search bar at the top and start editing it with our pitch deck creator.
Make your pitch deck stand out by adding images, graphs, and maps with the drag-and-drop editor from Piktochart. Pick from a library of free images and visual assets or upload your own images.
Either use our built- in presentation mode or download your pitch deck in PDF or Microsoft’s .ppt format. Piktochart also enables you to generate a sharable link so that yo can track the views of your pitch deck and resolve any questions through online comments.
“Everything I do is on Piktochart right now. It’s so easy for me to modify different pitch decks and it saves me so much time with the variety of templates.”
Venus Wong Psychologist and Affiliated Scholar, Standford University
“I just launched our all new IT branding here at Kraft Heinz using Piktochart. It has been so well received across the company and it’s all thanks to this application.”
Christopher Degnan Global Communications Lead, The Kraft Heinz Company
“I love Piktochart. It is so user-friendly and consistently and effectively produces amazing outcomes – taking presentations, reports, newsletters, etc to a new level of professionalism.”
Peta-Ann Small Director of Operations, Set Free Foundation
“The viral content we have created with Piktochart opened a lot of opportunities for us. Aside from that, we get more inquiries and clients, and there was once when we received more than a thousand inquiries in just one day because an infographic we created with Piktochart went viral.”
Anne Payuan Founder, The Bright Millenial
Scatter Plot Maker: Frequently Asked Questions (FAQs)
The horizontal axis of a scatter plot represents one variable (x values), while the vertical axis line represents the other variable (y values or y data). Typically, the independent variable is plotted on the x-axis line, and the dependent variable on the y-axis line.
Finally, add a chart title and labels for each value on each axis (y values and x values) to provide context and interpretation of the plotted input data.
Ready to create your own pitch deck?
Join more than 11 million people who already use Piktochart to create the perfect presentation.


