
Investing vs Trading
Infographics
Edit for freeYou'll be asked to log in or sign up for a free Piktochart account first.
This comparison infographic is great for visualizing the key differences between any two concepts. The dark creative aesthetic makes the visual appealing and eye-catching. You can customize almost all elements of this template with Piktochart. Clone or edit blocks. Replace the text. Add more icons, images, and illustrations. This infographic visualizes investing vs trading. Visualize your data with a bar chart. Sync your chart with a spreadsheet. Export in PDF or PNG format. Try out this template for free.
Available File Type
Customization
100% customizable
Tags
More Templates Like This
 Infographics
International Women’s Day Infographic
Infographics
International Women’s Day Infographic
 Infographics
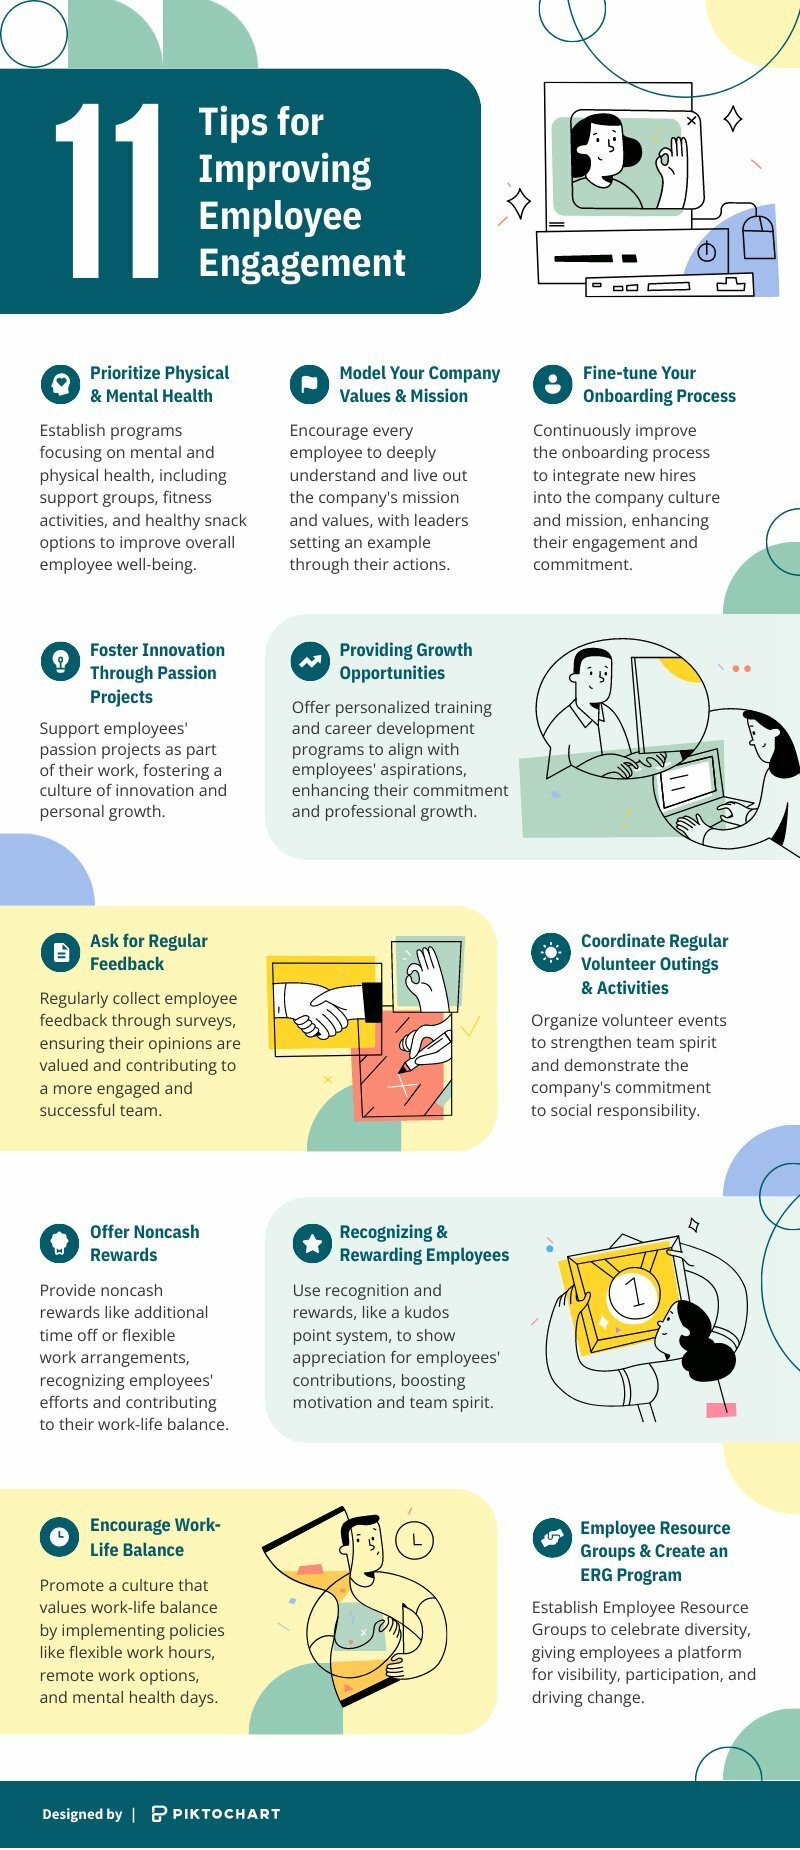
Tips for Improving Employee Engagement
Infographics
Tips for Improving Employee Engagement
 Infographics
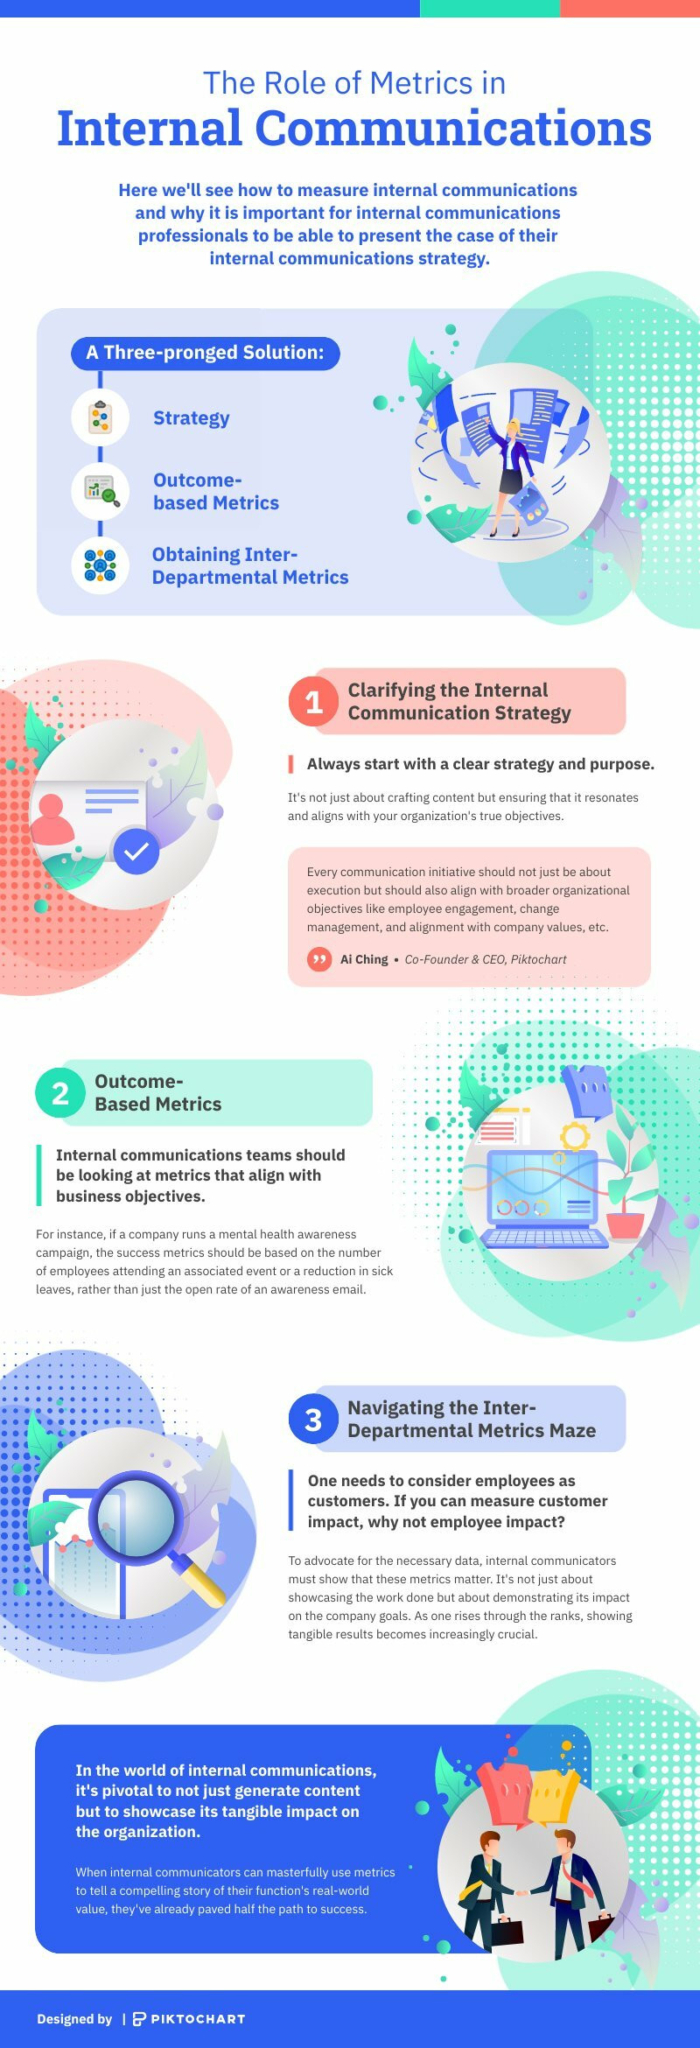
The Role Of Metrics In Internal Communications
Infographics
The Role Of Metrics In Internal Communications
 Infographics
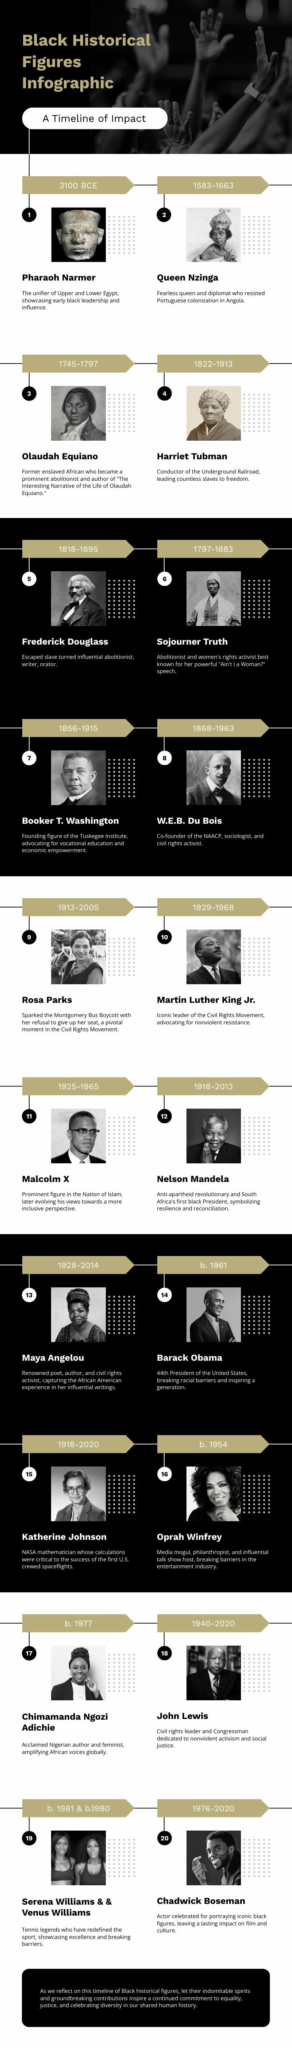
Black Historical Figures Infographic
Infographics
Black Historical Figures Infographic
 Infographics
Facts About Women’s History Month
Infographics
Facts About Women’s History Month
 Infographics
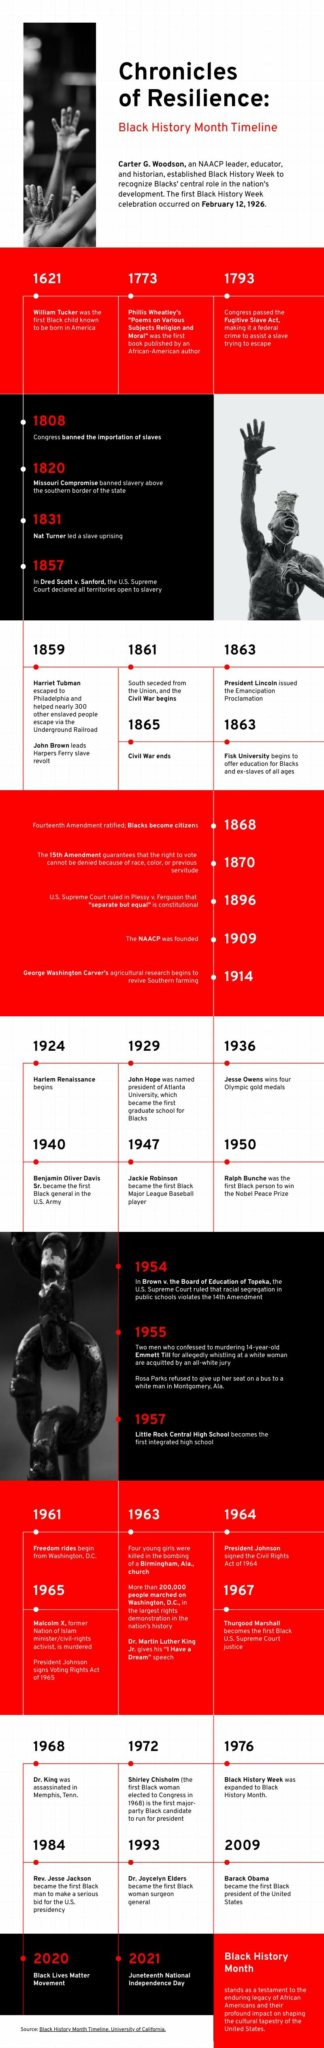
History of Black History Month Infographic
Infographics
History of Black History Month Infographic
 Infographics
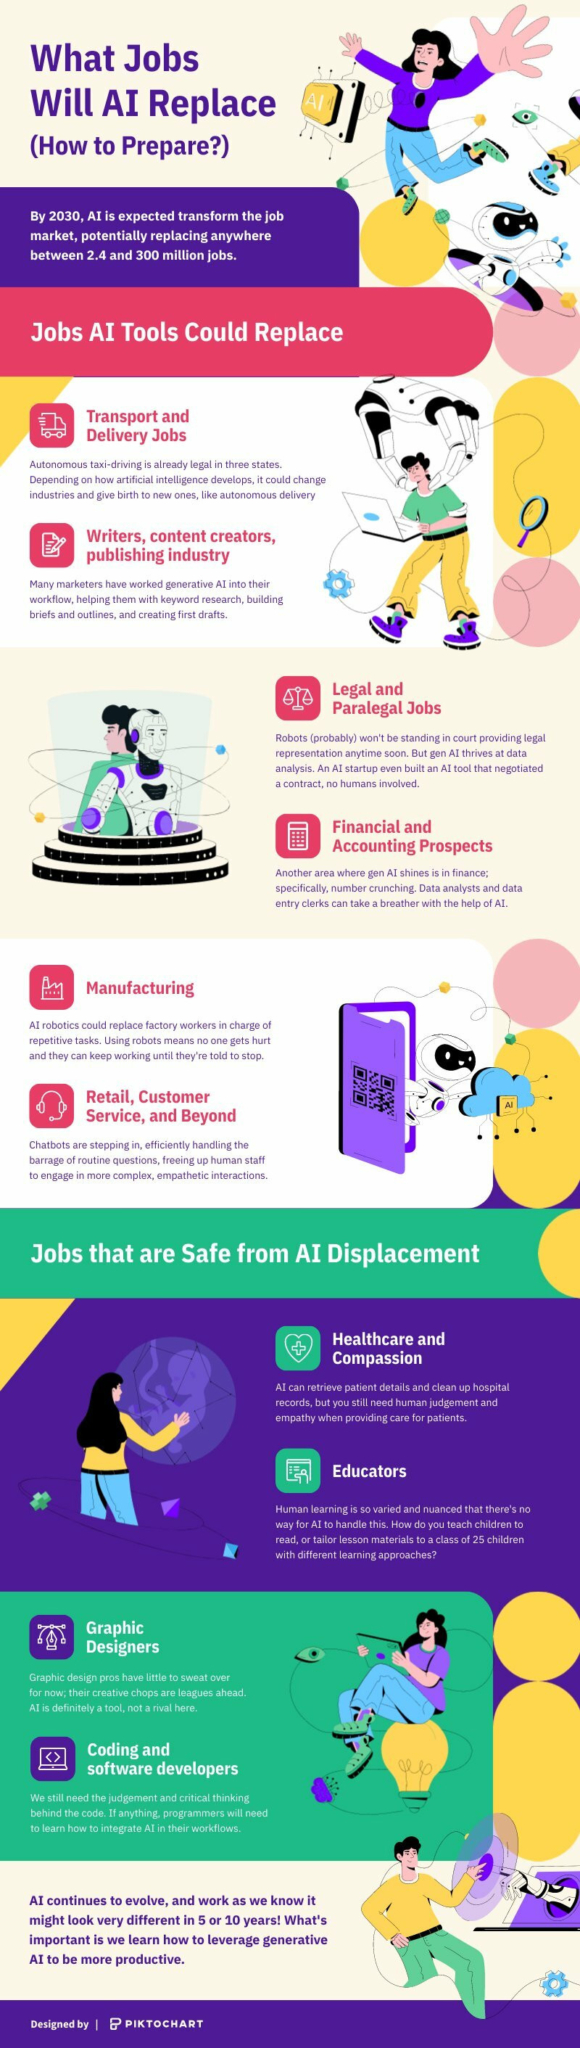
What Jobs Will AI Replace
Infographics
What Jobs Will AI Replace
 Infographics
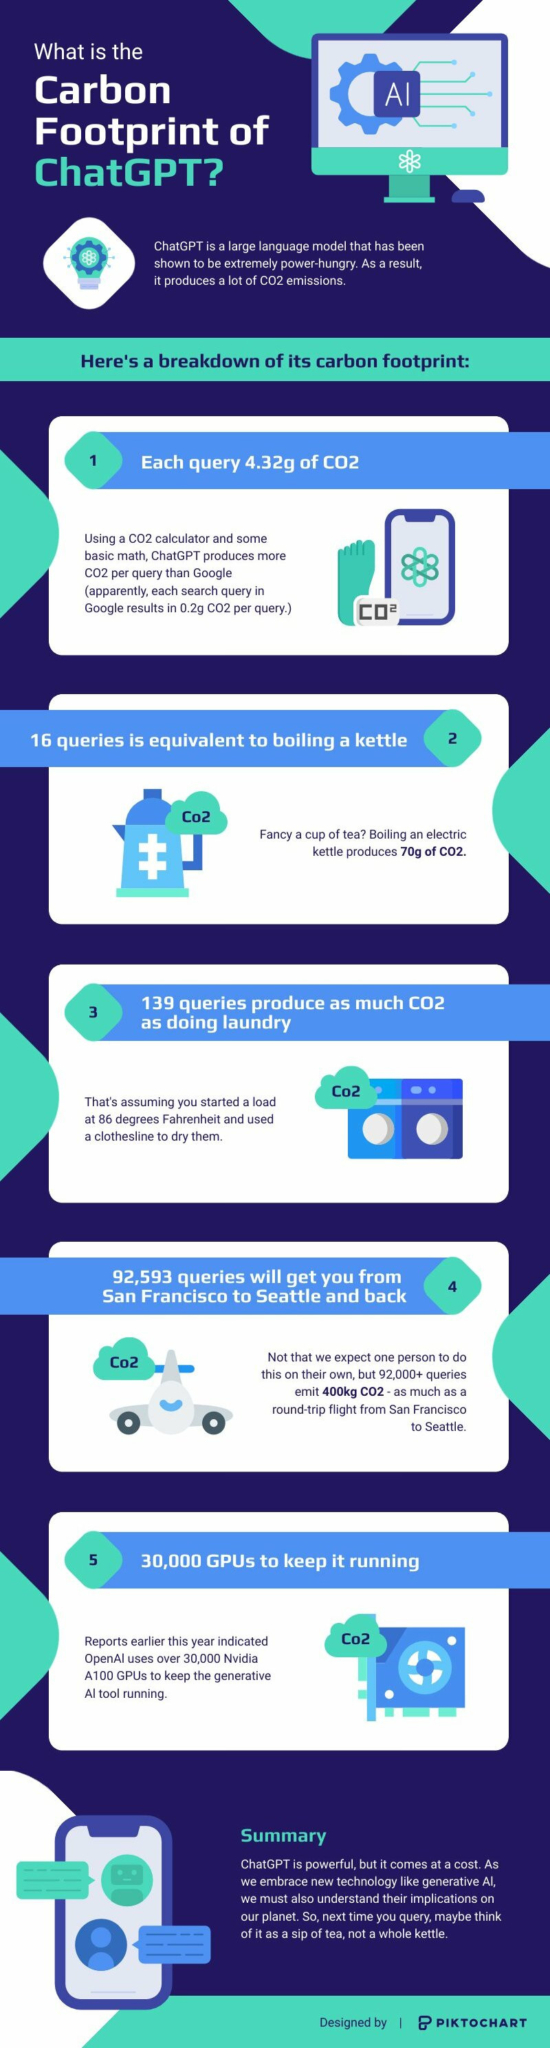
AI Carbon Footprint
Infographics
AI Carbon Footprint
 Infographics
Modern Mental Health Statistics
Infographics
Modern Mental Health Statistics
 Infographics
Mental Health Facts
Infographics
Mental Health Facts
 Infographics
Types of Internal Communications
Infographics
Types of Internal Communications
 Infographics
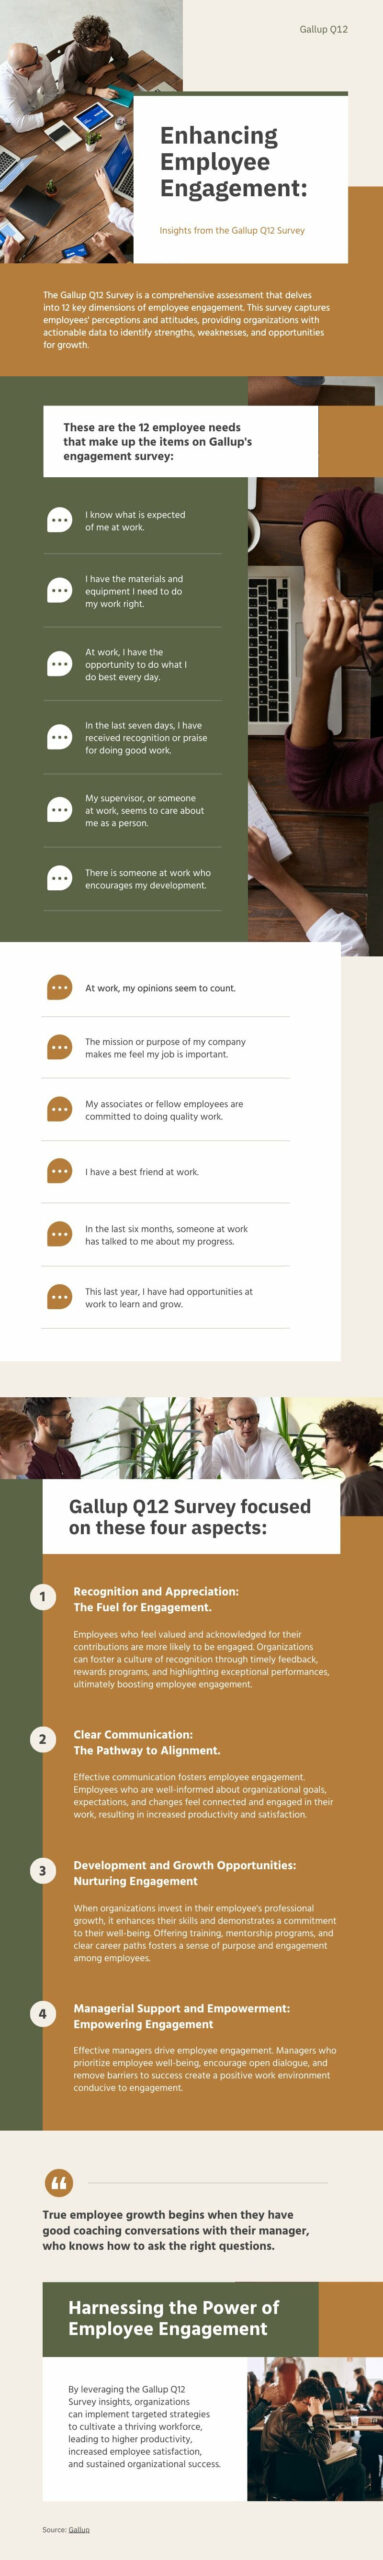
Gallup Q12
Infographics
Gallup Q12