Customer Story

How an Instructional Designer Uses Piktochart for E-learning and Virtual Classroom Designs

Karin Rex

Instructional Designer and E-learning Developer

  • Company
  • Company Website
  • Business Type
    Instructional Designer
  • Location
    Pennsylvania, United States
  • Friends with Piktochart
    Since 2016

Learning is an essential part of every human life regardless of age and culture. Since the pandemic in 2020, the adaptation of e-learning and visual classrooms has been on the rise across the board, from the corporate sector to education.

As part of our #PiktoChat series, Wilson had a brief chat with Karin Rex, an instructional designer and e-learning developer with more than 25 years of experience. Karin shares her love for technology, how visual communication helps her succeed in her career, and some of her favorite features of Piktochart.

WM (00:06):

Hello everyone, I hope you are well out there and thank you for tuning in to our #PiktoChat series. My name is Wilson and I’ll be your host for today’s #PiktoChat. If this is your first time listening to us, #PiktoChat is a series of chats with leaders and entrepreneurs who share their knowledge and experience in using Piktochart.

Today, I’m delighted to be joined by Karin Rex, an instructional designer and e-learning developer with more than 25 years of experience. Karin is a professional facilitator specializing in virtual classroom delivery as well as an instructional designer and developer focusing on e-learning and virtual classroom designs. Karin has been using Piktochart since 2016 and I’m excited to be speaking with her today.

Hello, Karin and welcome to our #PiktoChat. How are you doing over there?

KR (00:48):

I’m doing great. How are you today, Wilson?

WM (00:51):

I’m doing good and I’m so excited to be speaking with you today and also having you here in our #PiktoChat. Before I begin, I’m sure our audience would love to know you better.

Would you like to introduce yourself further, let us know how you got started in your professional career and what led to your current role?

KR (01:07):

You did such a nice job with my introduction. I don’t know what’s left to say. But since 1989, I’ve owned a company called GeekyGirl. I named it GeekyGirl because I love tools. I love technology and I just adore trying different things. My company is a boutique learning company based in the Philadelphia area. I spend a lot of time writing. That’s my wheelhouse and designing, as you said all sorts of synchronous and asynchronous learning experiences.

I also coach people on how to design for and how to facilitate in the virtual classroom because I’ve really found my home in the virtual classroom and in addition to Piktochart, which as you mentioned I’ve been using since 2016. I also use a whole bunch of other learning authoring tools like Captivate and Storyline, Rise, Camtasia, VideoScribe, Powtoon and even Lectora. I really enjoy what I do. I’m never bored.

WM (02:12):

That’s so encouraging to hear and I think also with what has happened in the past few years with the pandemic, you’ve also seen a rise in the need for virtual classrooms. Is that correct?

KR (02:21):

Yes. Mine is one of the few businesses that did not flounder at all. I have been consistently busy since the beginning of the pandemic, even now.

WM (02:32)

That’s encouraging to hear and well done to you. Thank you for giving us a better insight into your journey. I’m excited to get our conversation going and I’m curious to know first, how did you first discover Piktochart?

KR (02:45):

I don’t quite remember specifically where I found it but I know it was sometime in 2015-2016. It’s hard to believe that’s seven years already but one of my instructional design clients, InSync Training was doing a whole bunch of free one-hour webinars and they wanted to offer each of their speakers a personalized infographic to provide with their speaking sessions.

So that’s how I got started. I was making these bespoke infographics for each of the speakers. Those were my first official infographic projects. I still have many of them on my dashboard.

WM (03:23):

And so were you looking for an infographic tool and then you stumbled across Piktochart? Is that how it happened?

KR (03:28):

I imagine that was how it happened and it clicked with me instantly and I tried several. There were a couple out there at the time, but for some reason, Piktochart, first of all, your support was outstanding. And whenever I had a question, I was answered like within 24 hours, which is amazing. So, even from the beginning, the enthusiasm for the tool and the support that it provided was great.

And I also found that like this conversation, Piktochart wanted to hear what I thought of it. They consistently, you guys asked me, what do I like, what do I wish for? I had been wishing for that alignment tool for years and then finally we got it. It was great. So small things like that really made me very specifically a Piktochart fan.

WM (04:21):

Thank you so much for saying those kind words It’s really encouraging for us, especially in our team because we try to be as user-focused as we can. That’s why we get on calls to hear from our users getting their feedback and of course trying to continue to improve the product as well. Thank you for supporting us relentlessly since 2016.

Can you let us know as well, because in your role that you mentioned about you designing and developing e-learning courses, can you let us know why is visual communication so important for your role as an instructional designer?

KR (04:52):

Sure, I have no formal graphic design training. I’ve been in the field for 30 years but have no formal graphic design training. I was a typesetter back in the 80s. I’ve been in the learning and development field for 20 years. Over that time, I believe the aesthetics of good design rubbed off on me and I think my clients have responded very positively to my designs. But true talent development professionals really need to understand that training is not the solution to every performance problem.

Sometimes it takes a much simpler tool like a checklist or an infographic, and what I find with Piktochart, it helps with the aesthetics. It helps me look like I have some sort of graphic design background. It makes what I create look good. That’s what I needed. And it was a perfect tool at the perfect time for me.

“What I find with Piktochart is it helps with the aesthetics. It helps me look like I have some sort of graphic design background. It makes what I create look good. That’s what I needed. And it was a perfect tool at the perfect time for me.”

Karin Rex, Instructional Designer and E-learning Developer at GeekyGirl

WM (05:47):

I appreciate you mentioning about like sometimes it’s also like having a checklist or infographic because I think with design, you can communicate the message more clearly than just reading a long page of some instructions on how do you do certain things. Is that correct? Is that in your experience as well?

KR (06:03):

It is and, I mean, you’ve consistently added new categories too. I think in the beginning it was just infographics and maybe presentations, but then you added reports and then you added posters and like social media size and things like that. So that really can help someone like me who has a sense of design but is not a designer to make beautiful things.

WM (06:29):

I’m so glad to know that Piktochart has been helpful for you as well. I think in a lot of the users that I speak with, not everyone has a professional graphic design experience and so we recognize that as well. We try to make sure that our tool is as easy as it can, whether you are a super experienced designer or you’re a beginner, you have no experience. It should be intuitive for you to be able to use it. Thank you for sharing that.

You’ve been using Piktochart since 2016. Perhaps you could share a little bit about how visual communication or Piktochart in general has benefited your company or your career?

KR (07:03):

It helps make me look good. Makes me look good to my clients and I think I mentioned this to you before, but I actually teach Piktochart too. There have been a few opportunities where I’ve had a small audience and gotten them together to learn how to create Piktochart.

Matter of fact, one of the courses that I wrote for ATD, which is the Association for Talent Development. It’s one of the largest organizations in the field. I do a course called ‘Writing for Learning’ and it’s a 5-week, three-hour session, so it’s 18 hours or more of learning. In one of the sections, I actually bring them into Piktochart and show them how to create a simple step-by-step set of instructions using all the bells and whistles that you can imagine. I think people really like that.

“Piktochart helps make me look good. Makes me look good to my clients.”

Karin Rex, Instructional Designer and E-learning Developer at GeekyGirl

WM (07:57):

That’s an awesome initiative that you started. You’ve mentioned about you creating a lot of visuals in Piktochart. You also taught people how to use Piktochart. If you could narrow it down to one of your most proudest creation, or the most successful creation with Piktochart, what would that be?

KR (08:13):

You’re going to laugh, Wilson. My personal favorite infographic that I’ve ever created is one that the client rejected. I’m not joking. I was just speaking to you about writing for the instructional design and training certificate program that I created for the Association for Talent Development.

So I had recently read Stephen King’s book on writing. Stephen King is one of the best American writers in the world. I have nothing but admiration for him. I’m not necessarily a fan of the horror genre but I love his writing and his book on writing was very instructive for me. So then I developed this writing course for ATD and I sort of was asked to create an infographic that they would send out to help market the class. The reason why I love this one is because I really went sort of crazy on the gore factor. And I made this feel pretty Stephen King-ish.

Now, when I teach the class, I show everybody this infographic. Let them know that sometimes you can love your own creation so much, but it doesn’t mean that you throw it out. Don’t throw the baby out with the bathwater. So that’s one of my favorites.

Another one of my favorites is this series that I did for design class and what this is I teach a lot of visual communication tips in my writing and my design classes, and I teach them something called WRAPW, which stands for white space, repetition, alignment, proximity, and wording. White space, repetition, alignment, proximity, and wording are very important visual communication tips.

So I teach about the importance of using a lot of white space, which is called sometimes negative space and how white space can have a really positive impact on your learners, on your visuals. I teach that using repetitive design elements throughout a document really adds a sort of a sense of cohesiveness and continuity to a document. Proper alignment. That’s the A. That helps convey order and harmony to a page. And proximity lets you create kind of a level of emphasis because proximity is about grouping together – like items. And then that final W in WRAPW is for writing and more importantly editing yourself.

WM (13:38):

I like how you have created different examples, showing people what not to do and what looks the best. I know that you mentioned that you don’t have any graphic design experience, but I think the WRAPW is such a great key things that in fact, I think our designers would really appreciate it. Because we also teach that, but whatever you say just encapsulates all the design elements that we also teach to our users.

Thank you so much for sharing that! I think you’re doing such a wonderful job with the designs that you’ve shown us here. Let’s move on to the next question.

Now, as someone who is actively using Piktochart and I think you shareed a bit about the tips that you mentioned just now. But if you could offer perhaps the most important visual communication tips for instructional designers, what would that be?

KR (14:27):

Editing your writing is key to the success of any infographic. Your wording needs to be tightly written. It’s not going to be your first draft. Sometimes it will take me 16 drafts of something to get the wording to be exactly the way I want it to be. I think that 99% of good writing is editing and you need to take the time.

I also provide a system for self-editing in my writing class that has people looking at things like, “Are you using any unnecessary filler phrases?” “Are you using huge complicated words when simple wording will do?” Small things like that can really impact a successful design in Piktochart. So, edit yourself.

WM (15:26):

Finally, to wrap up, would you mind sharing with us what is your favorite feature about Piktochart?

JB (15:33):

There’s two things that I love about it. I love that you provide mono graphics that can then be colored to match my design, and match my clients color palette. Those are hugely important to me.

I’ve mentioned this before, the alignment tool. Probably my favorite. Just the fact that I can position one item on one side and the other on the other and have it horizontally spread or vertically spread that I can align tops of things. When that came out, that really made my job a lot easier because prior to the alignment tool, I was doing things like drawing boxes or lines and moving them and making sure that everything was lined up. So it took a lot of time. I really was happy when that tool came out. That’s probably my favorite.

WM (16:22):

Yeah, I love hearing that and always encouraging to hear the features we have released have been helpful. It’s also something that you are looking for. In fact, we’ve received a lot of feedback for the alignment tool and that’s why we decided to work on it and also have improved it along the way.

Thank you so much for being patient with us and now we’re glad that the tool is helpful for you. It was truly a pleasure to be speaking with you today, Karin. Thank you for sharing your story with us and also showing your design with us in this #PiktoChat. We’re grateful for you for being an advocate of Piktochart and visual communication.

If we have some listeners who’d like to stay connected with you, how can they do that?

KR (16:59):

I’m on LinkedIn. Just look for Karin Rex or you can visit my website, karinrex.com

WM (17:12):

We’ll be sure to also leave that in the show notes so that you can stay connected with Karin on LinkedIn and also check out her website.

So if you’re listening to this and if you enjoyed this episode, feel free to check out the rest of our #PiktoChat episodes. We have many more inspiring stories from different leaders and entrepreneurs out there. That’s the end of our #PiktoChat today and goodbye.

Infographic Templates Recommended for Instructional Designers

International Women’s Day Infographic Infographics International Women’s Day Infographic
Tips for Improving Employee Engagement Infographics Tips for Improving Employee Engagement
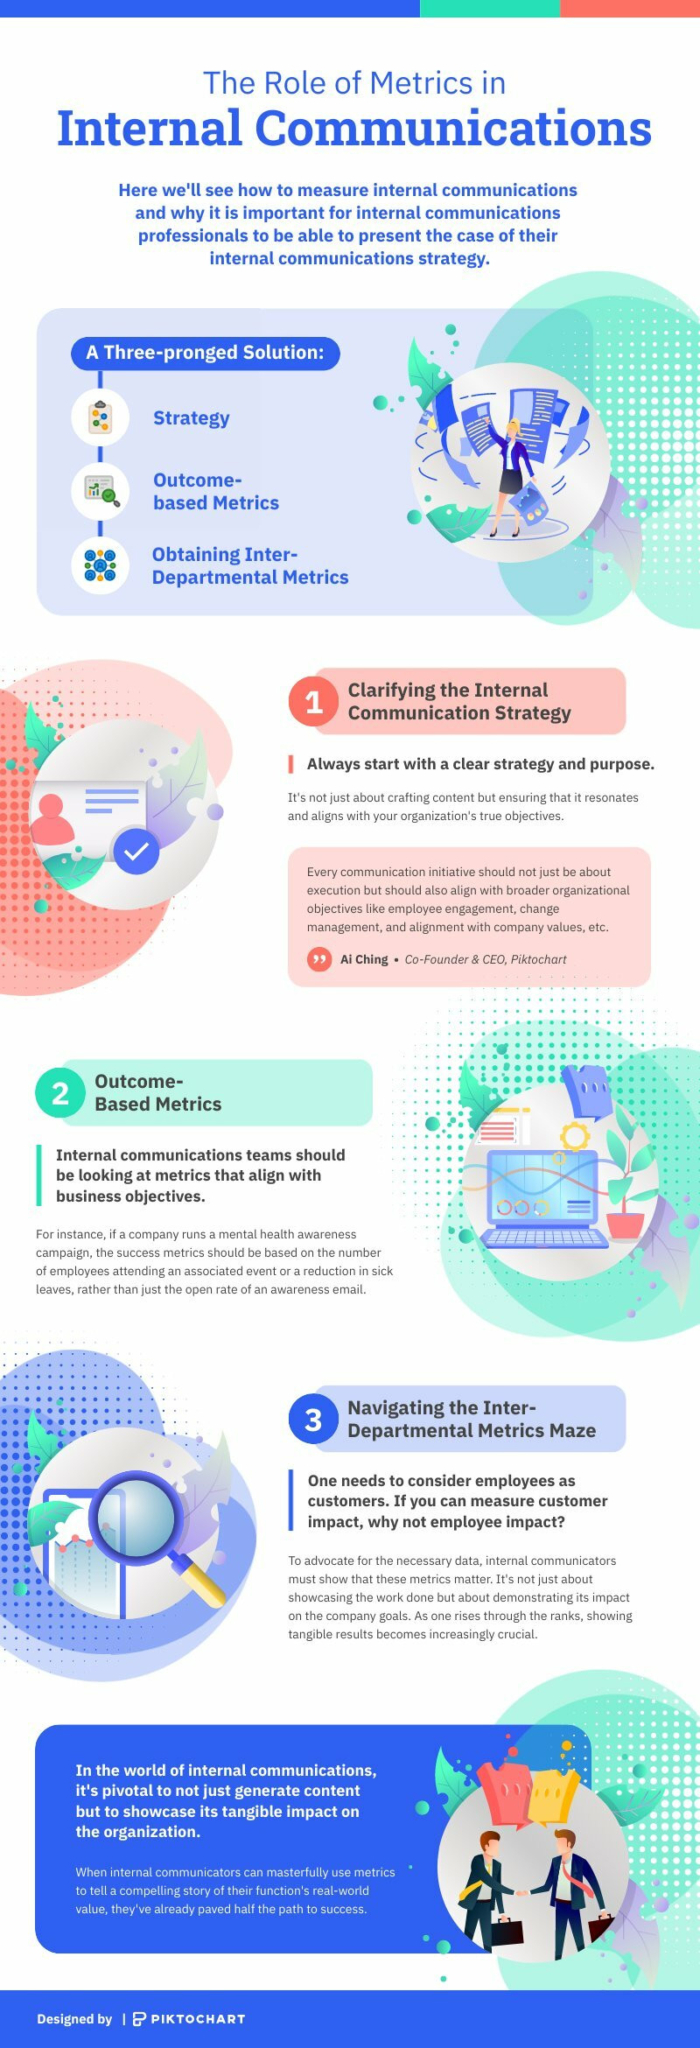
The Role Of Metrics In Internal Communications Infographics The Role Of Metrics In Internal Communications
Black Historical Figures Infographic Infographics Black Historical Figures Infographic
Facts About Women’s History Month Infographics Facts About Women’s History Month
History of Black History Month Infographic Infographics History of Black History Month Infographic
Explore more infographic templates

Ready to create an impressive infographic?

Join more than 11 million people who already use Piktochart to craft amazing visual stories.

More stories

Jamie Barkin

English and AP Literature Teacher at Wheaton High School

High school teacher, Jamie shares how Piktochart helps her improve learning in her classroom for her students.

Read Story

Dr. Aaron Fischer

Psychology and Psychiatry Professor at University of Utah

As a university professor, Dr. Aaron Fischer shares how Piktochart helps him to create resources to provide mental health support in schools.

Read Story

Theodore Paat

Instructional Designer at Affirm

Theo did a lot of research for various platforms ranging from Venngage to Canva. Find out why he decided for Piktochart.

Read Story