The new way of visualizing timelines

Create With Speed
Transform data into visual stories in seconds
No more tedious manual design work. Piktochart AI analyzes your data and generates timelines with precision and speed, saving you time and effort. Experience the ease of automation and save valuable time.
Start creating
Contextualised Content
From text content to digestible timeline
Save time without the need to design from scratch. Piktochart AI allows you to paste your own text content and our AI-powered generator will perform the design work for you. Watch your text content turn into a captivating timeline in seconds.
Start creating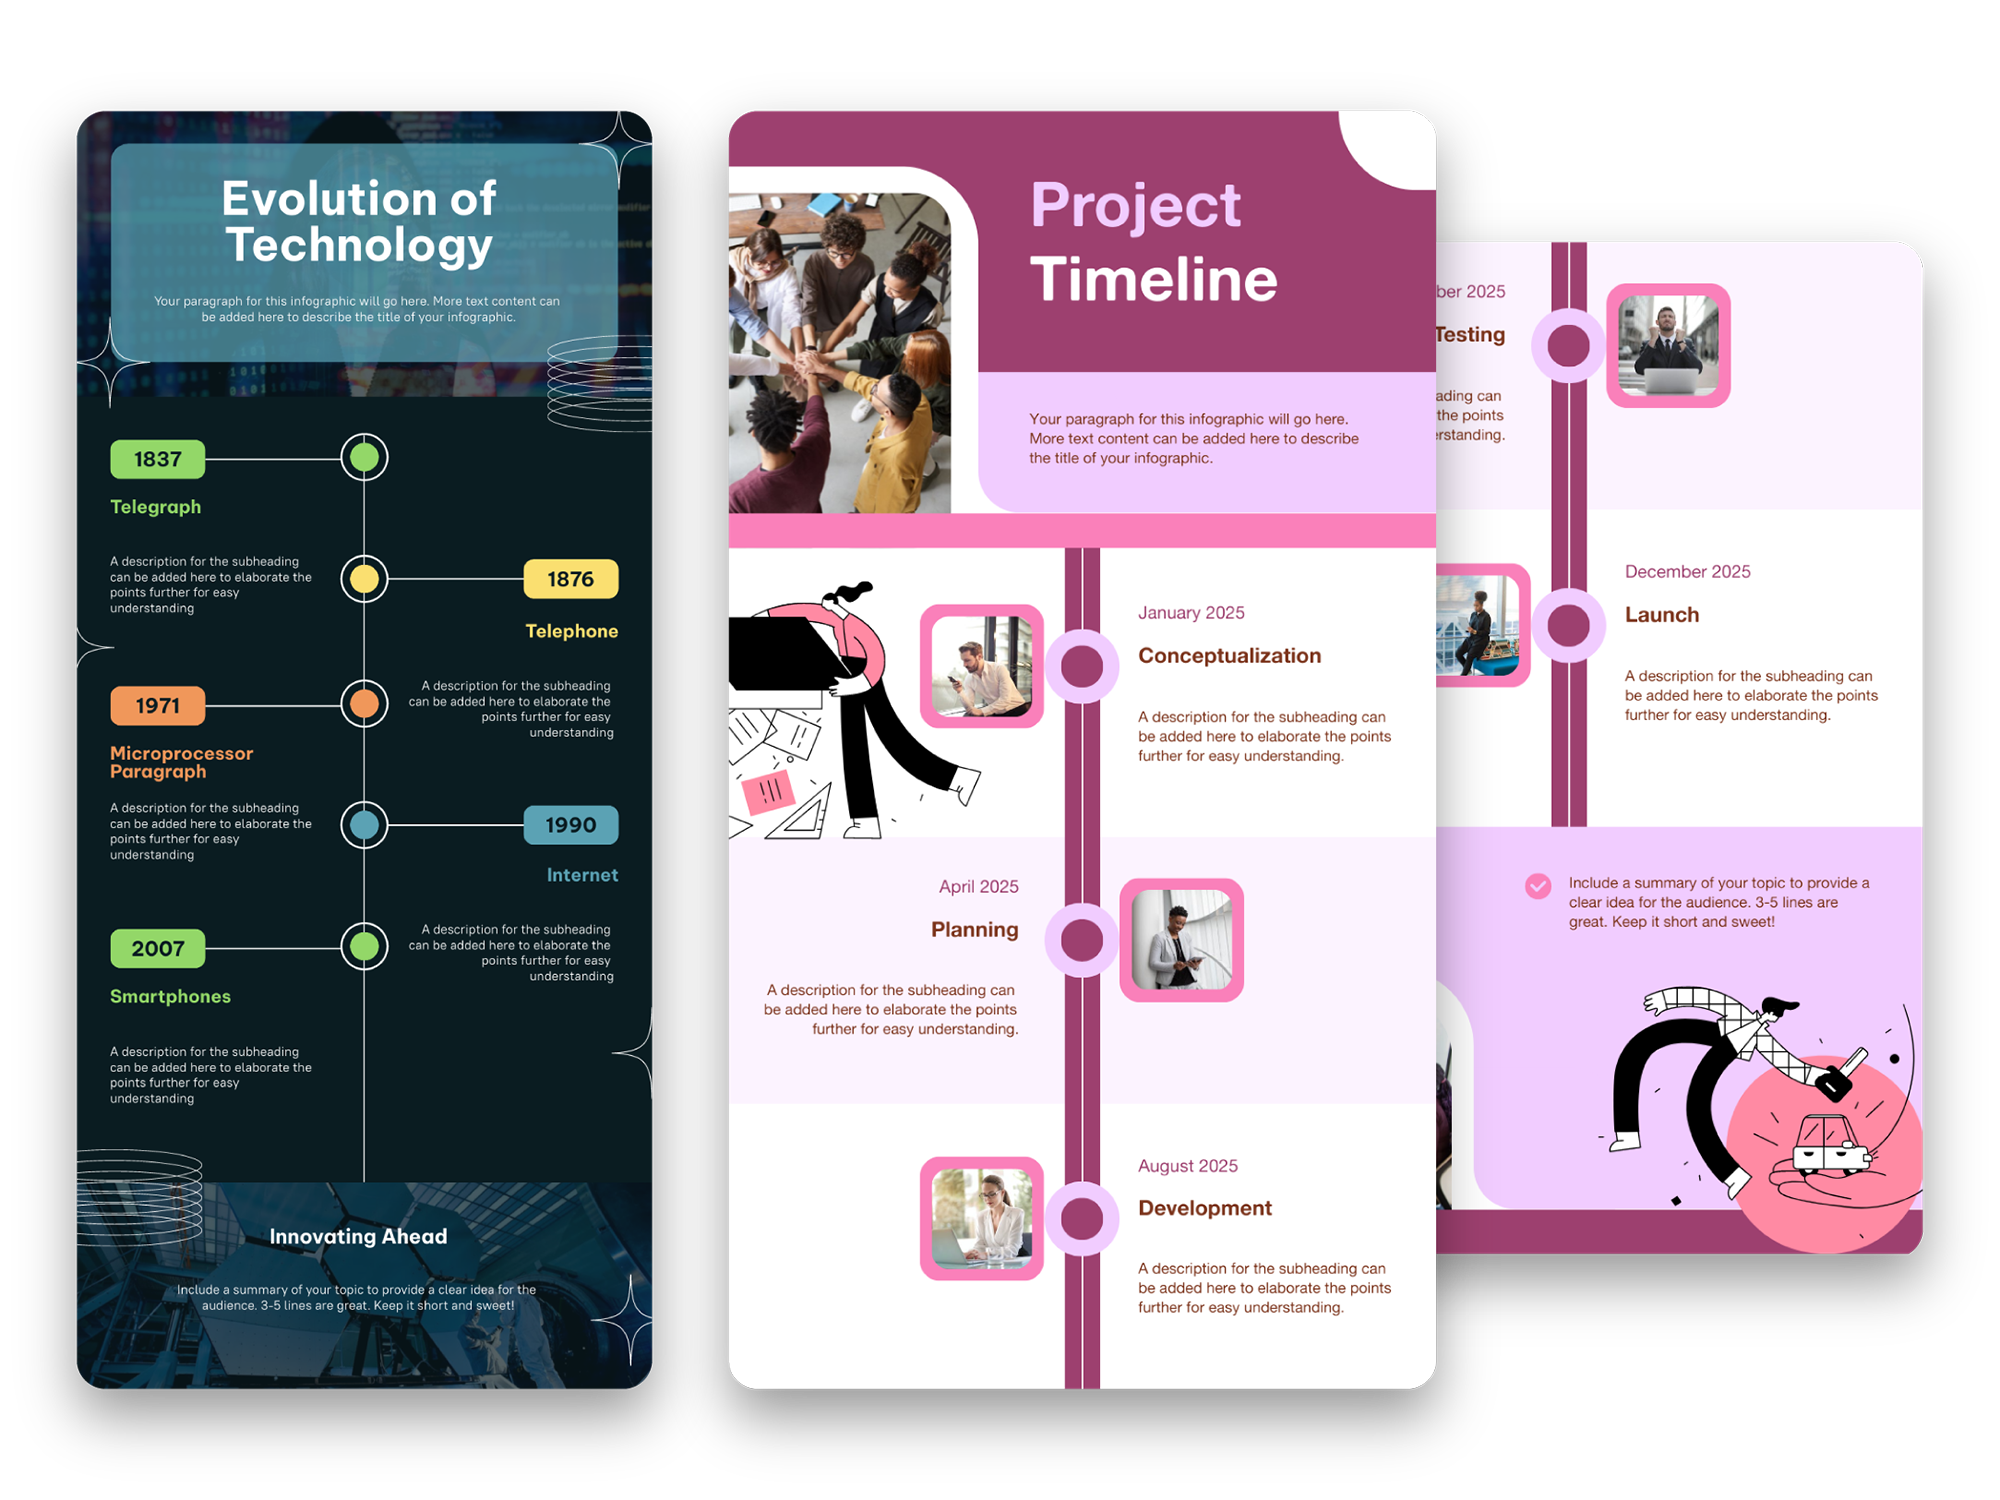
Captivate Your Audience
Turn complex data into a compelling narrative
Whether you’re tracking a project’s status, sharing company milestones, or presenting historical events, Piktochart AI enables you to communicate information effectively. Make it easy for your audience to understand the evolution of events or the progression of projects.
Start creating
Creativity With Customization
Express your creativity with ease
Tailor your timelines to match your brand identity with Piktochart AI’s versatile customization options. Choose from a rich library of templates, graphics, and design components that seamlessly integrate with your unique style.
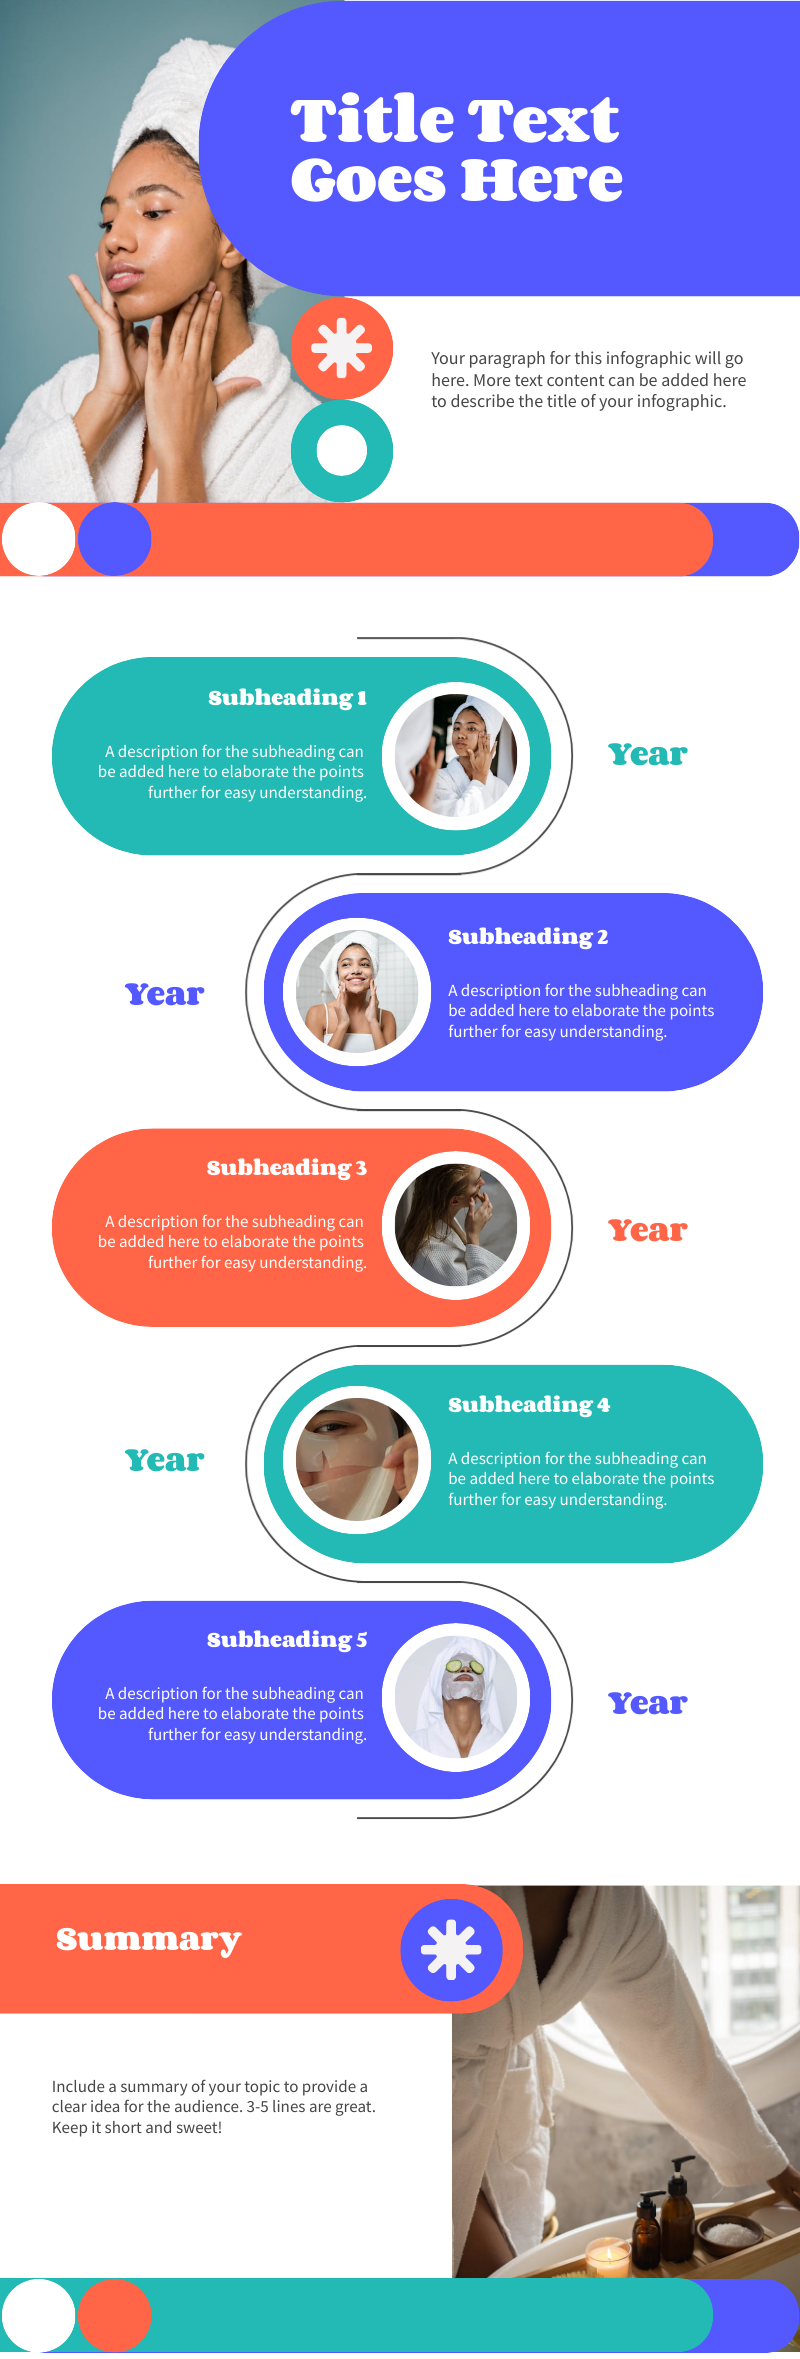
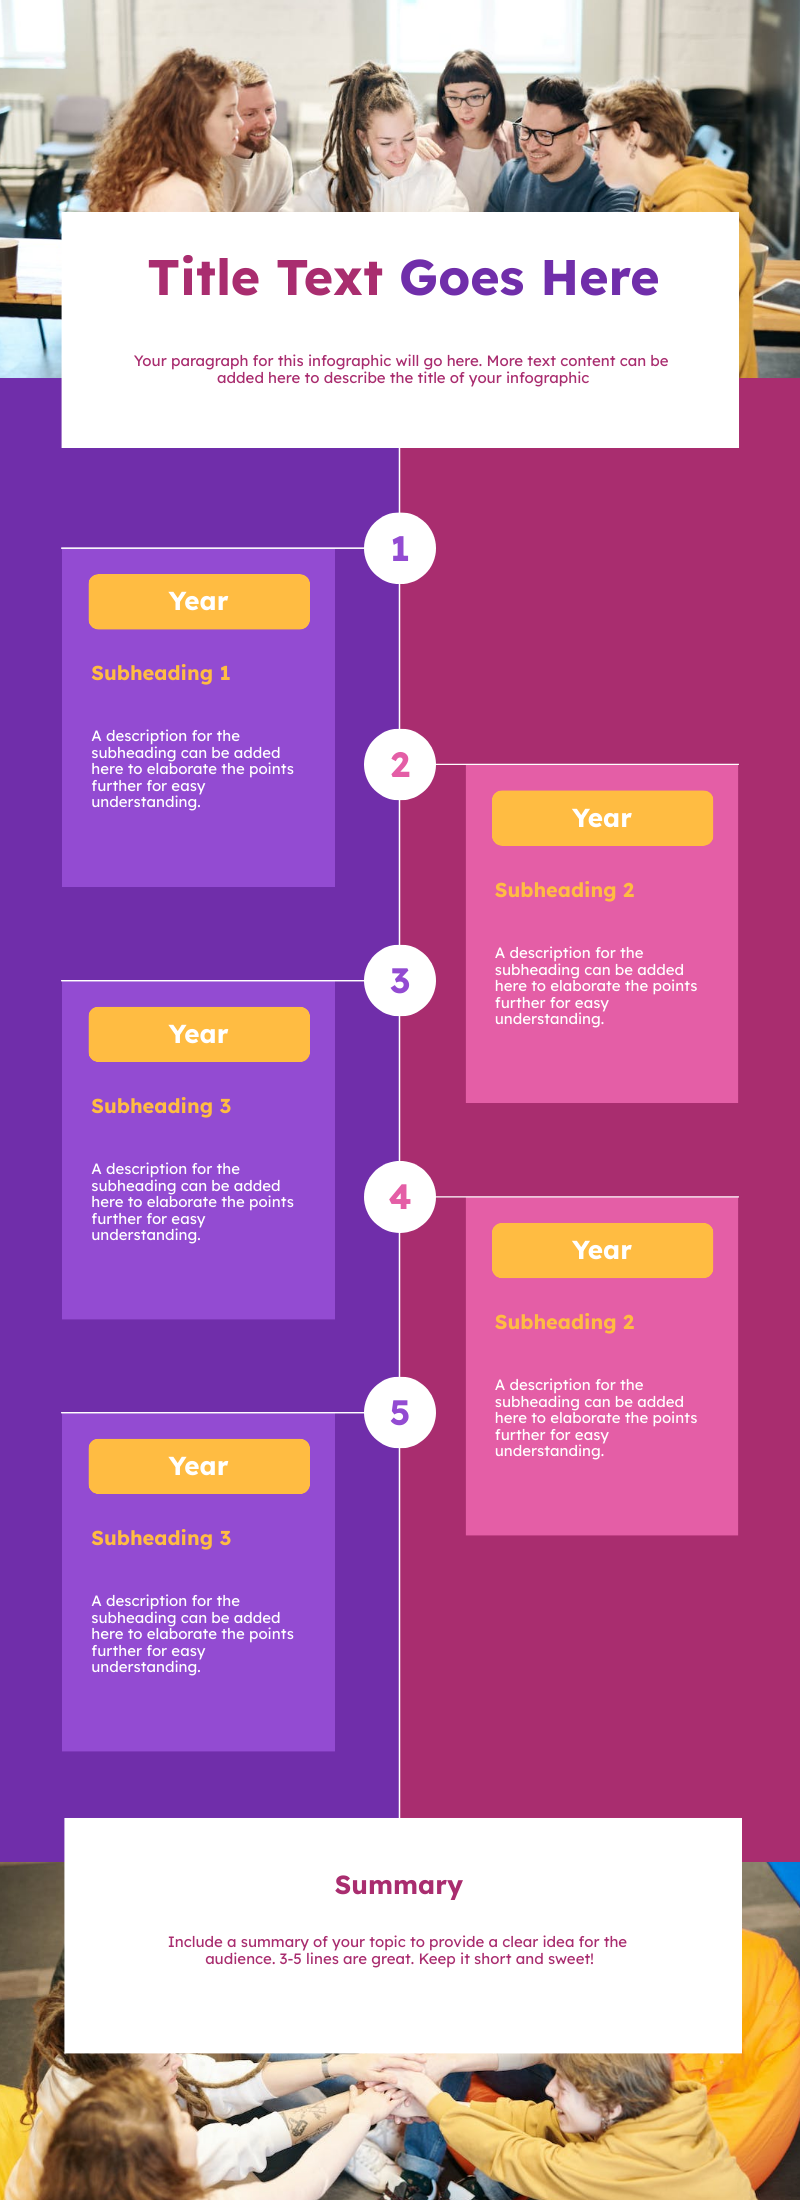
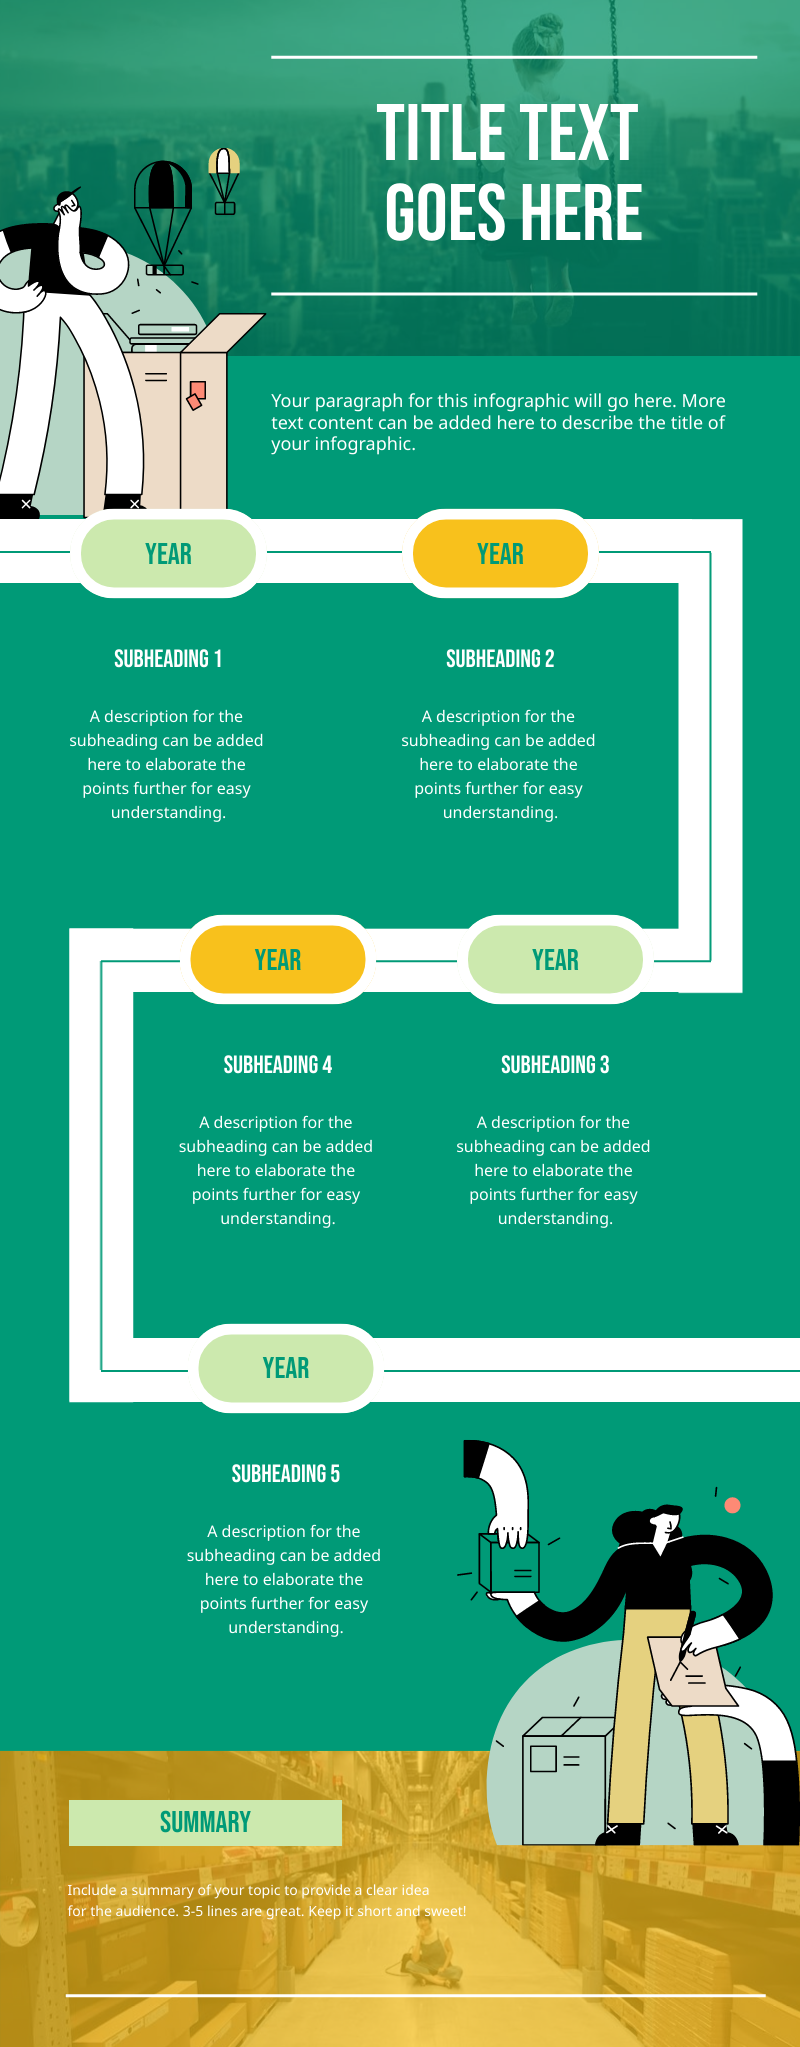
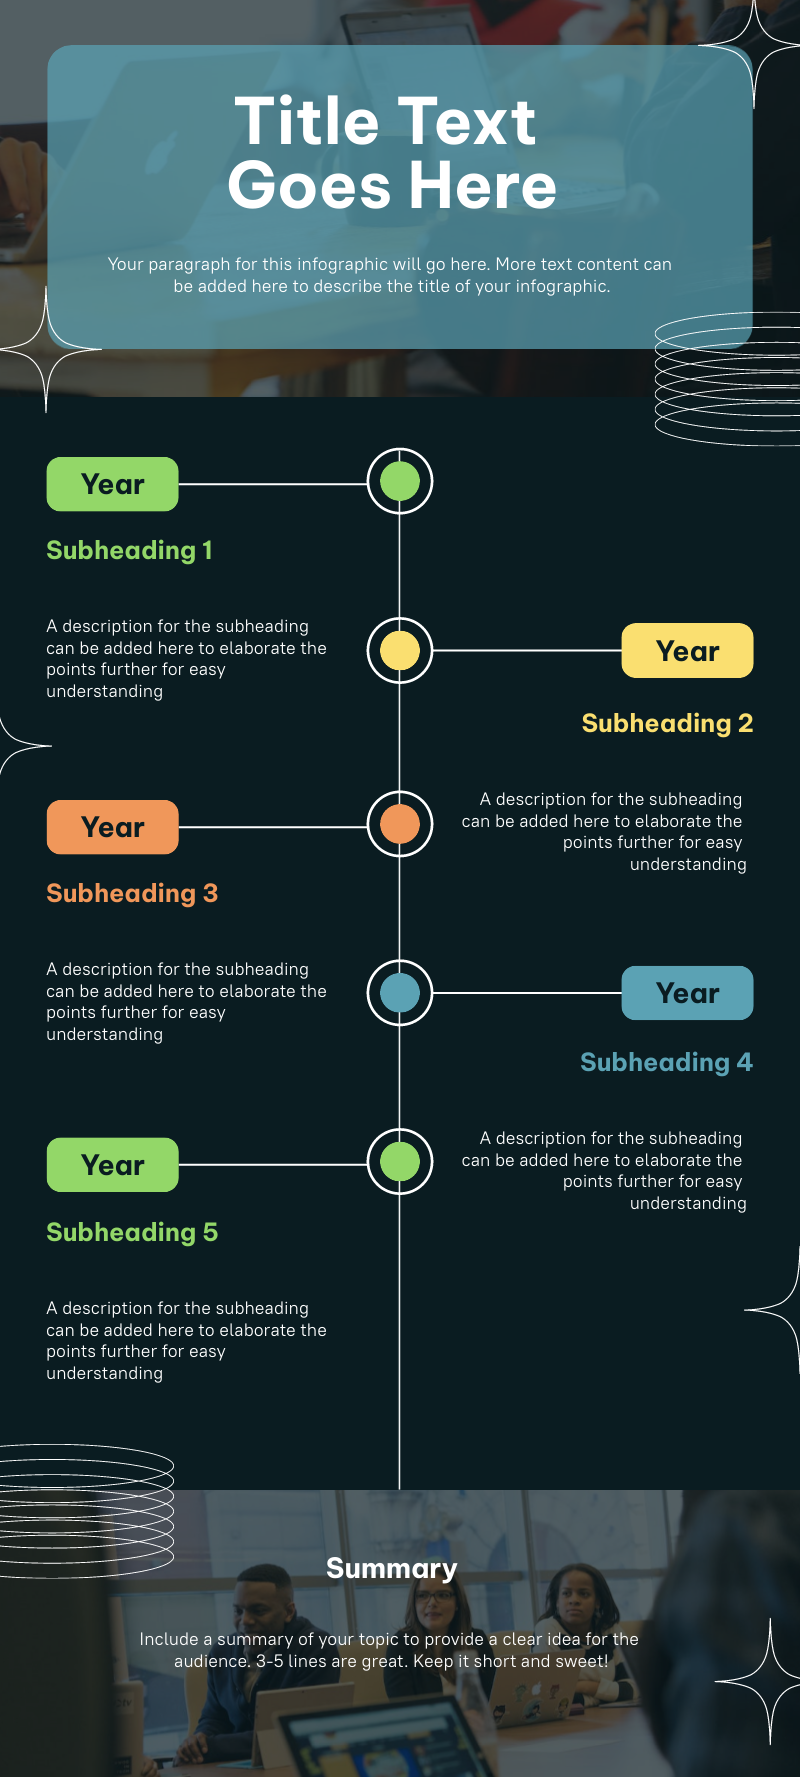
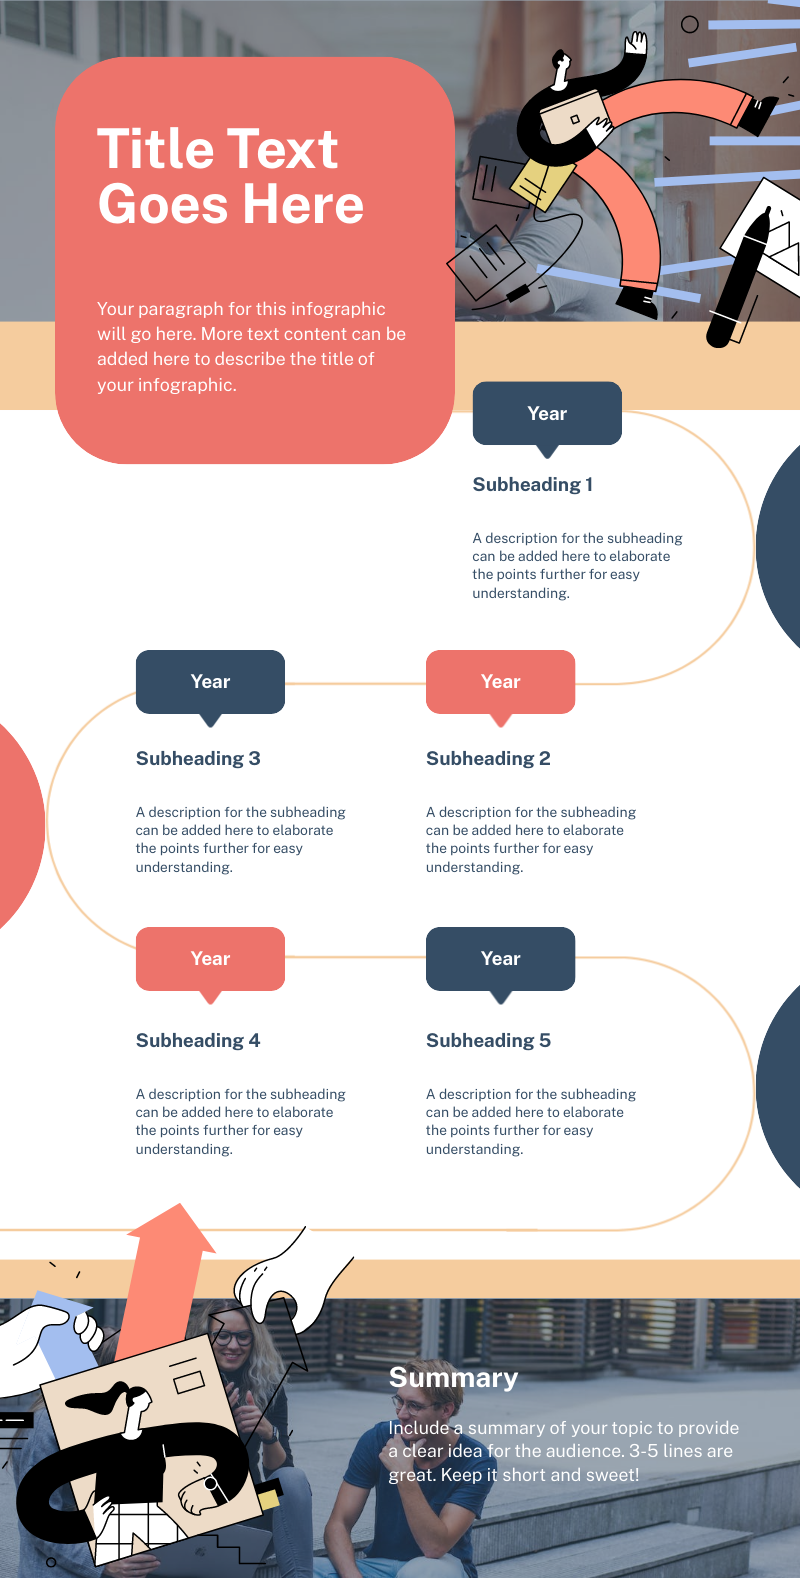
Start creatingTimelines created using Piktochart AI timeline infographic generator
Testimonials
“Piktochart is my go-to tool when I’m looking for a way to summarize data that is easy for our upper management to review. Piktochart provides me with the tools to display data in a creative, visually appealing way.”
“Piktochart has allowed me to change the style of my company’s communications. The campaigns are more visual, modern and attractive thanks to the templates that always serve as inspiration. Now even my colleagues use it! Piktochart helped me to engage, increase participation in events, add value to internal campaigns and to reinforce the culture and communication flow of my business.”
“As an HR Assistant, I have to find new and creative ways to engage our employees and effectively communicate across a large organization. Piktochart has tremendously helped me in achieving this.”
“Piktochart helps me translate often dry financial policies and accounting standards to easy to understand and concise one-pager visuals for management.”
How to Generate a Timeline Infographic Using AI
1. Share your timeline idea
Describe in up to 120 characters the timeline you’re looking to visualize – whether it’s for a historical event, project milestone, or company timeline.
2. Choose from our library of timeline infographic templates
Skip creating your timeline from scratch. Piktochart AI generates a collection of pre-made templates, so all that’s left is to pick a timeline design that suits you.
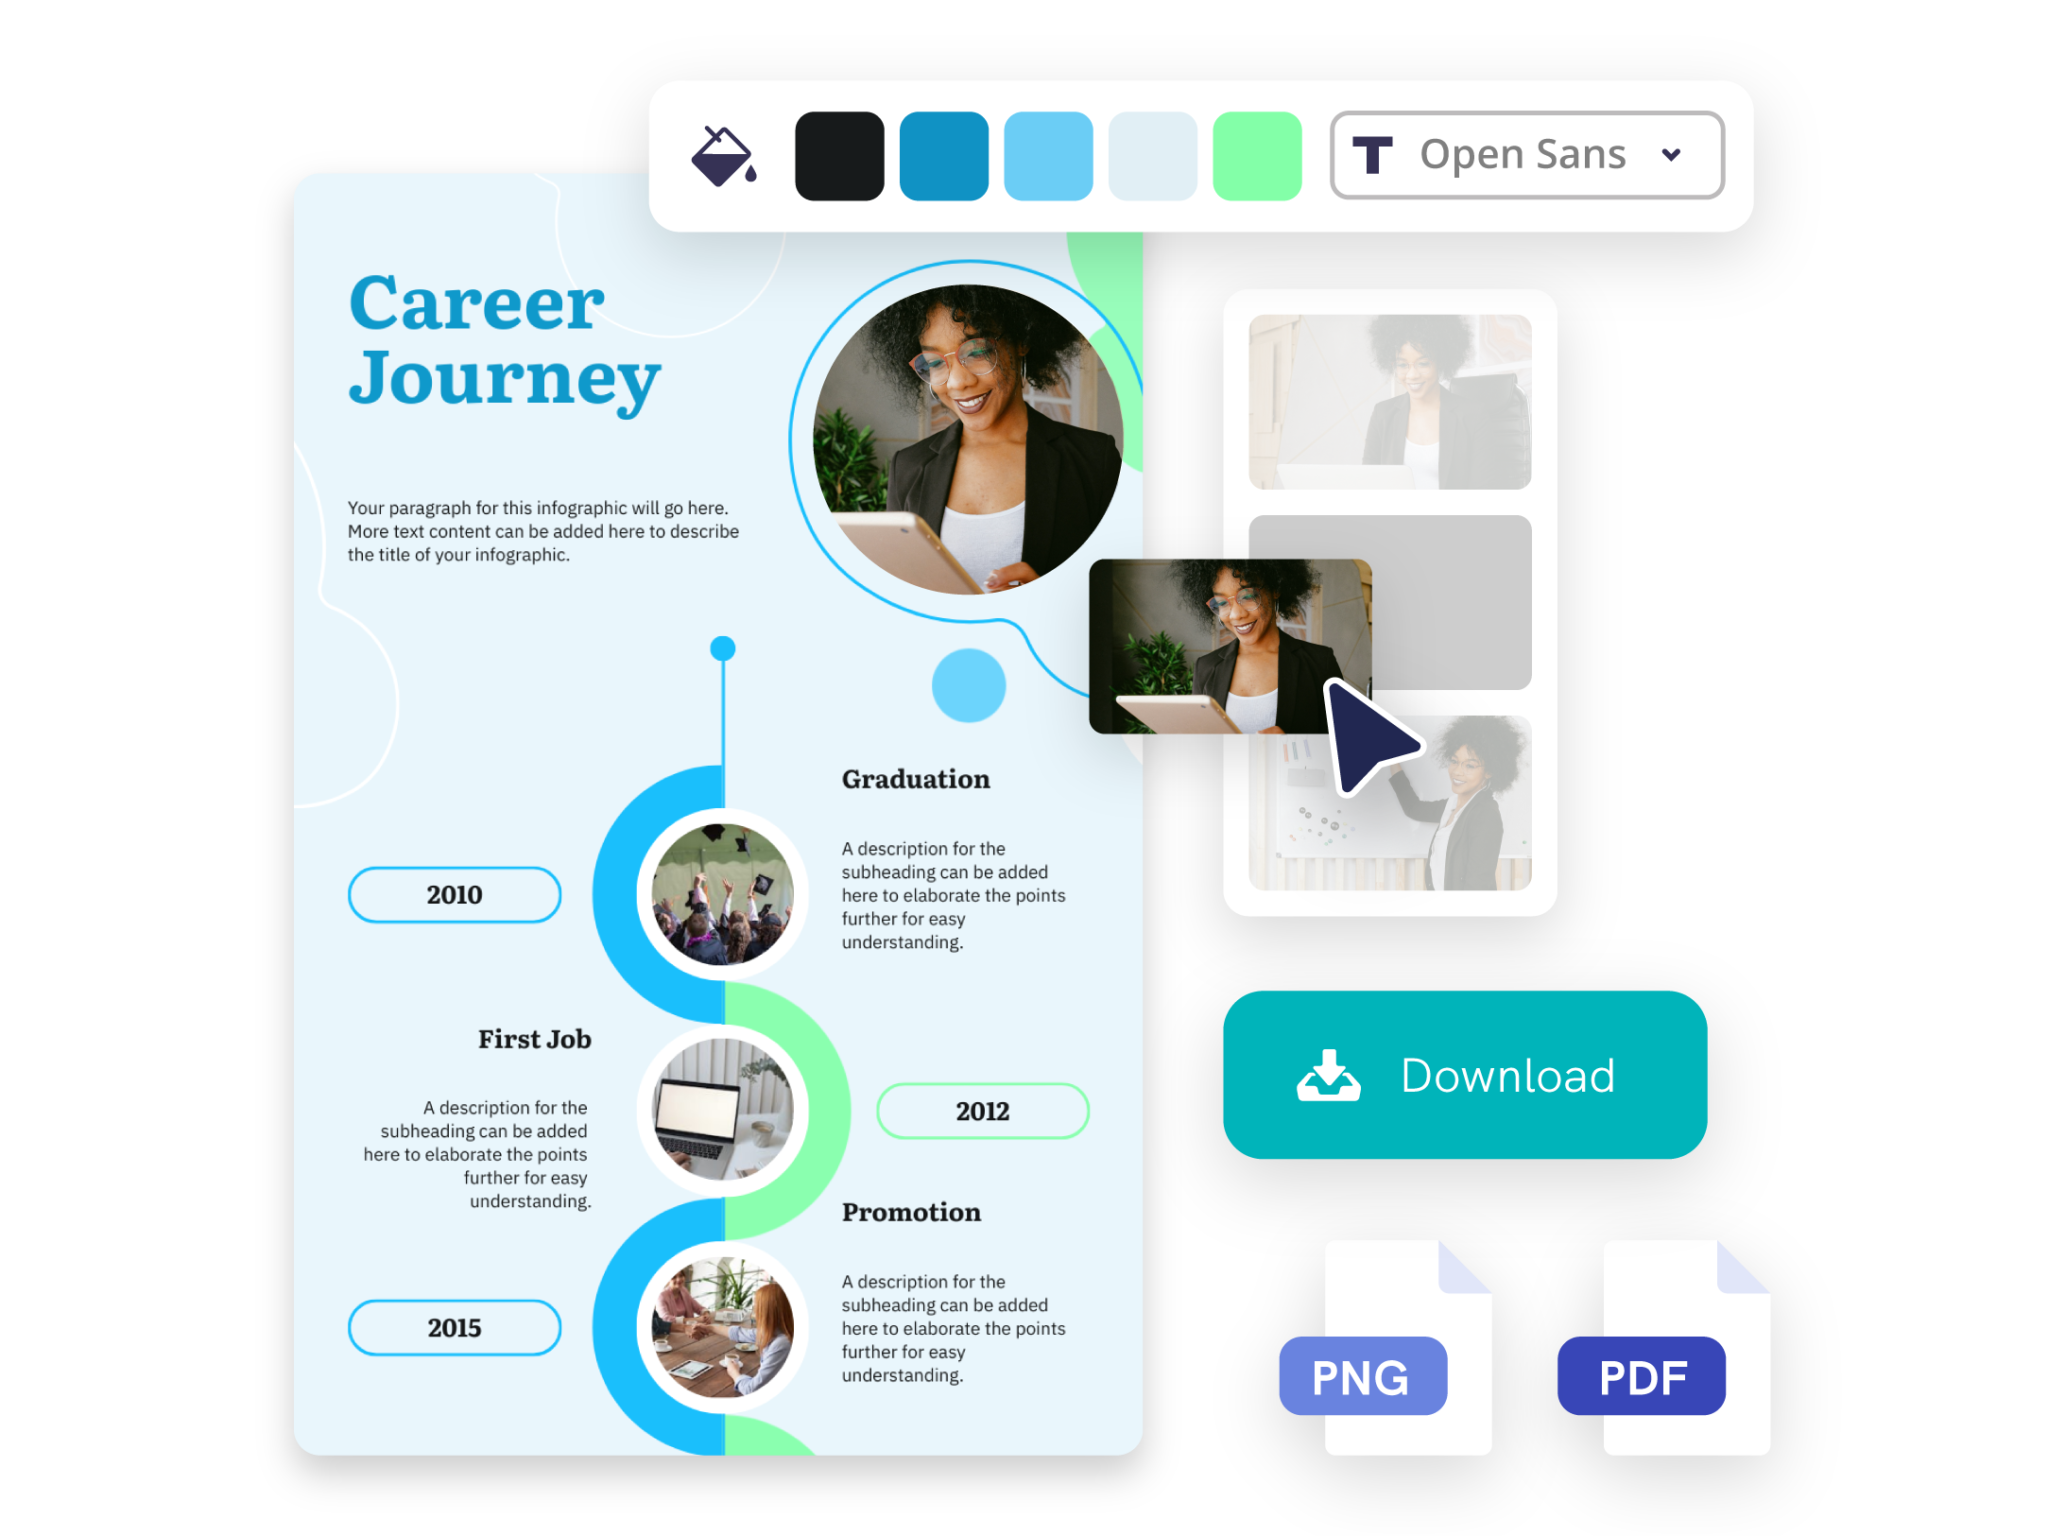
3. Edit your design in Piktochart
4. Customize with images, icons, and other assets
Tailor your timelines to fit your unique style and branding. Choose from a diverse range of fonts, colors, and assets to create timeline infographics that resonate with your audience.
5. Publish and share your timeline
Once you’re done customizing your timeline, save your work and download it in PNG or PDF (Pro subscription required). It’s now ready to be shared on social media, with stakeholders, or in your press releases.
AI-Powered Visualization for Any Topic
What kinds of timelines can be generated using this AI tool?
Business timeline
Highlight your company’s achievements and growth over time with professional timelines that inspire stakeholders and potential investors.
Historical timeline
Help your audience to quickly understand the interconnection of the past, present, and future by visualizing the evolution of historical events over time – whether it’s for a product, society, or any topic.
Process and steps timeline
Keep your team on track by generating detailed project timelines that outline key milestones, assign tasks, and visualize progress.
Ready to use AI to generate timeline infographics?
Join more than 11 million people who already use Piktochart to craft amazing visual narratives.