
Imagine having a tool at your fingertips that not only simplifies this process but elevates it to new heights. That’s where AI chart and graph makers come in, transforming the way we visualize data in 2024.
Each of these tools brings something unique to the table, from intuitive interfaces to advanced customization options. Whether you’re a seasoned data analyst or just starting, these tools are designed to make your life easier and your presentations more impactful.
In this article, we’ll explore the top five AI chart and graph makers released so far.
GraphMaker
GraphMaker is adept at what it’s name suggests. Its specialty is transforming complex data sets into visually stunning and easily interpretable charts and graphs.
Known for its user-friendly interface, it’s easy to create all sorts of data visualizations, ranging from line charts, bar charts, and pie charts.
The AI-driven analytics feature suggests the most effective way to present your data. This smart assistance helps in making complex decisions about data representation simpler, ensuring that your graphs accurately reflect the insights you intend to convey.
AppyPie
AppyPie is a well-known no-code app development platform. The AI graph maker creates data visualizations based on your prompt. Renowned for its simplicity and efficiency, it enables users to create charts and graphs with minimal effort.
You provide AppyPie with a prompt, and it’ll make a graph accordingly. Its drag-and-drop interface makes creating complex graphs simple.
The AI-powered insights are another key feature, offering helpful suggestions on how best to interpret and present your data. This means you get smart guidance to make your data more understandable and impactful.
The tool also includes a wide range of customizable graph templates. These templates save time and give you a starting point for your designs.
For those who need to make their reports and presentations more engaging, the tool’s interactive reporting feature is quite handy. It allows you to create reports that are not just static images but interactive, making your data presentations more engaging.
Appy Pie’s graph maker works across multiple platforms. This means you can easily share your graphs and collaborate with others, no matter where you or your team are working from. This multi-platform compatibility is great for teamwork and for sharing your work with others easily.
Pricing
AppyPie provides a basic free version, perfect for simple graph-making needs. Its premium plans start at $7.99/month, unlocking more templates and advanced features.
ChartAI
ChartAI is a simple AI-powered tool that leverages natural language processing to transform simple text inputs into detailed, valid Mermaid code. It brings a unique blend of simplicity and sophistication to the creation of charts and graphs.
The interface can seem overwhelming at first. On the left hand sidebar, you can choose from a range of templates. On the right hand side, you can edit the templates by writing more specific prompts for certain types of graphs and charts.
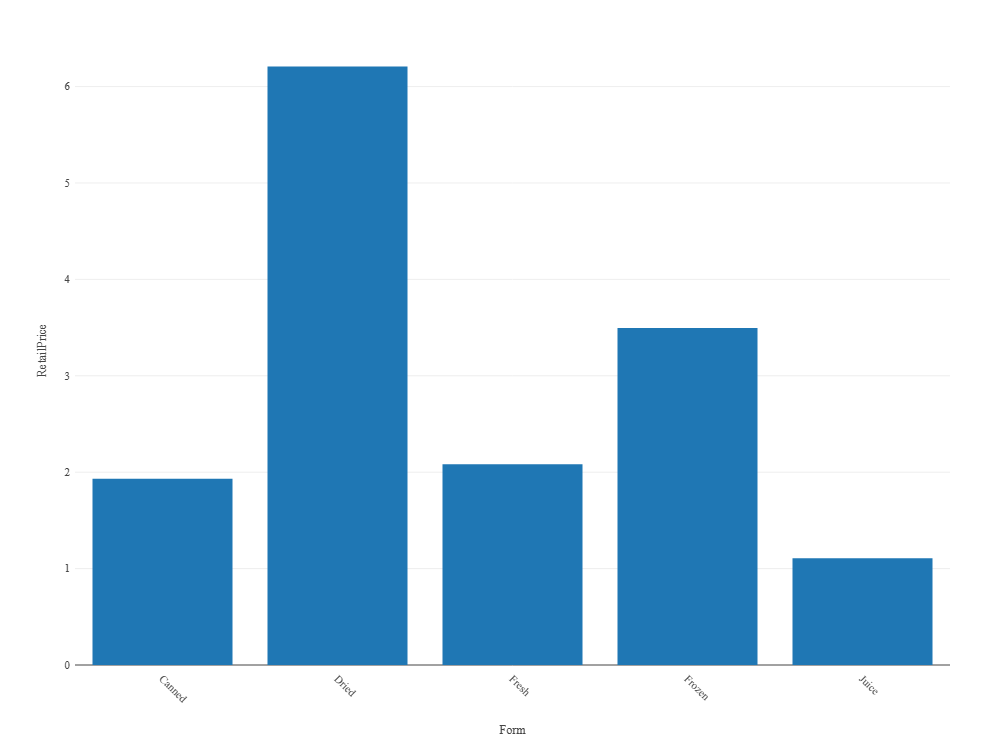
ChartAI interpreted instructions fairly well and created a bar chart without too many issues.
For non-coders or design beginners, the tool is great to quickly create a graph online. However, keep in mind that ChartAI generates Mermaid code, which is the output. If you prefer more coding formats, you might want to try other tools built on other programming languages.
Pricing
- 5 free credits
- 1,000 credits for $5
- Monthly subscription or one-off payment options available
Julius.ai is a chatbot that turns text prompts to charts. It’s more sophisticated and takes an interative approach. You’re given 20 credits for free to create one or two charts and graphs.
Making a graph took slightly longer than other tools, but only because it would finetune and give suggestions. You’re asked to link or upload a dataset from various sources, like a CSV file or a Google Sheets doc. After that, it’ll ask more questions on how you want to visualize the data.
Using Julius.ai was straightforward. The response isn’t rapid, as it takes time for the AI to process your requests, but the output was pretty good for the minimal input you provide. There are other statistical models you can create for more complex visualizations.
If you’re open to paying for a versatile artificial intelligence tool to create beautiful charts from large datasets, you might find a good use case for Julius.
Pricing
- Basic Plan for $17.99/month, suitable for moderate use with 250 messages per month.
- Essential Plan for $37.99/month, for more extensive use with unlimited messages.
- Pro Plan for $49.99/month, includes all features of the Essential plan, plus premium support and early access to new features.
ChartGPT
ChartGPT is a data visualization tool that has uses a chatbot to generate charts. It’s a free-form text box, so you can ask it to create any type of graph based on your requirements.
The online graph maker is created by a solo developer and made mostly with Typescript.
It works for the most part. You receive three free credits to test the tool.
However, there were a few shortcomings. I found that more complex instructions can often break the tool, which means a wasted credit. You also cannot customize the graphs after it’s made one, so you’ll need to finetune your inputs.
For simple charts and graphs, this can make quick work when you need to insert something basic into your presentation.
Pricing and Accessibility
- Works on a credit basis
- Starts from 20 credits for $5
- Scaling pricing, up to 260 credits and more for $80
What is the best AI graph generator?
When exploring the realm of AI graph generators, selecting the best tool hinges on a blend of several key factors. Here’s a balanced overview of considerations to guide you in making an informed decision.
- Use Case: Different AI graph generators cater to varied needs. For instance, tools like Google Sheets AI excel in business and academic applications due to their simplicity and integration with other Google services. Meanwhile, specialized tools like Julius.ai or ChartGPT might be more suited for users requiring advanced data analysis or the ability to convert text descriptions into charts.
- Types of Data Sets: The nature of your data plays a crucial role. Some tools are adept at handling large, complex datasets, offering detailed analysis and predictions, while others might be better for straightforward, smaller-scale visualizations.
- Level of Customization: The extent to which you can tailor the output varies widely. Tools like ChartGPT and Julius.ai offer varying degrees of customization in terms of visual aesthetics and data representation styles. Choose a tool that aligns with your need for personalization.
- Pricing: Budget considerations are paramount. While some AI graph generators offer free versions with basic functionalities (like Google Sheets AI), others may require a subscription for advanced features. It’s important to assess the cost against the value provided.
- Ease of Use: If you’re not well-versed in data science or programming, you’ll likely prefer a tool with an intuitive interface and straightforward functionality. Tools that require less technical expertise can be more appealing for a broader user base.
- Integration Capabilities: Consider how well the tool integrates with other software and platforms. Seamless integration can significantly streamline your workflow, especially if you are already using related tools or platforms.
If you’re planning on inserting your charts and graphs within a larger visual, such as a report or infographic, why not use Piktochart AI to speed up the process? You can create long-form visuals in seconds from a single prompt that’s designed with expert templates to make it look sharp.
Once you’ve picked a report or infographic that you like, you can add charts or graphs from within our editor in seconds. Don’t take our word for it – give it a try for yourself!