
According to a recent survey by Zapier, 76% of respondents said they spend 1-3 hours a day simply moving data from one place to another. Additionally, 73% of workers spend 1-3 hours just trying to find relevant data or a particular document. Another survey by TrackVia found that 44% of workers spend more than one day per week on manual, administrative tasks such as generating reports.
Fortunately, there are tools available to automate the report creation process and produce high-quality reports efficiently. However, it’s essential to understand the key factors that make a report effective and distinguish your report from the rest, without relying on plain Excel/PowerPoint tools.
Are you ready to take your report writing skills to the next level?
A business report is a document that presents information in a structured format, typically written for a specific audience or purpose. Business reports are used to convey data, research findings, recommendations, and other types of information in a clear, concise, and organized manner.
Business reports may be written for a variety of contexts. They may vary in length and complexity, depending on the type of information being presented and the intended audience.
You can also jump right into creating business reports by selecting a template and following along this guide, or create a report using our AI-powered report maker for free today.
Table of Contents
General Business reporting templates
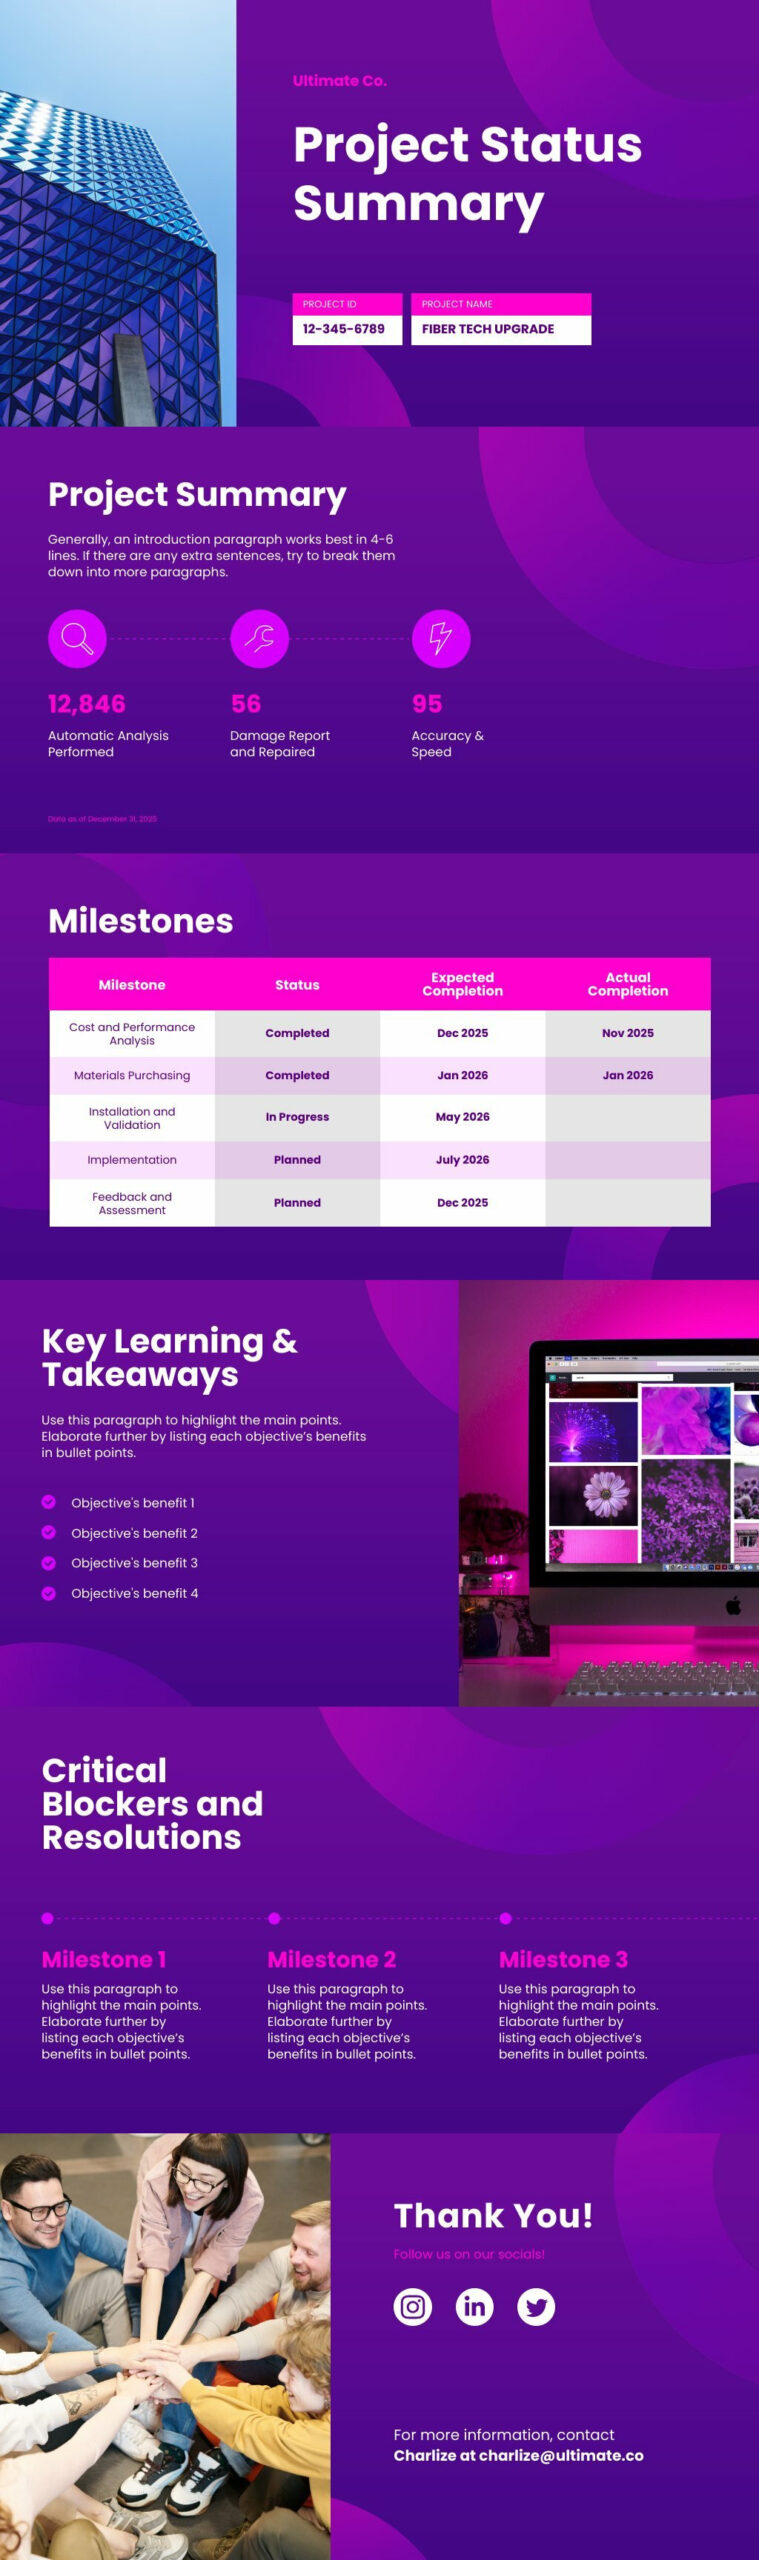
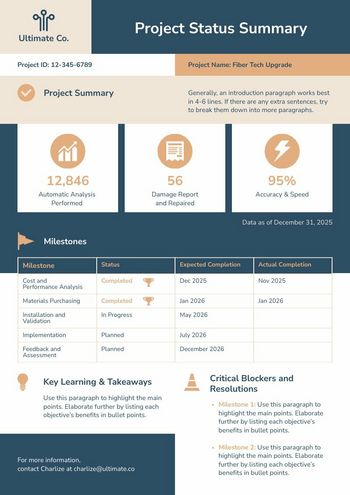
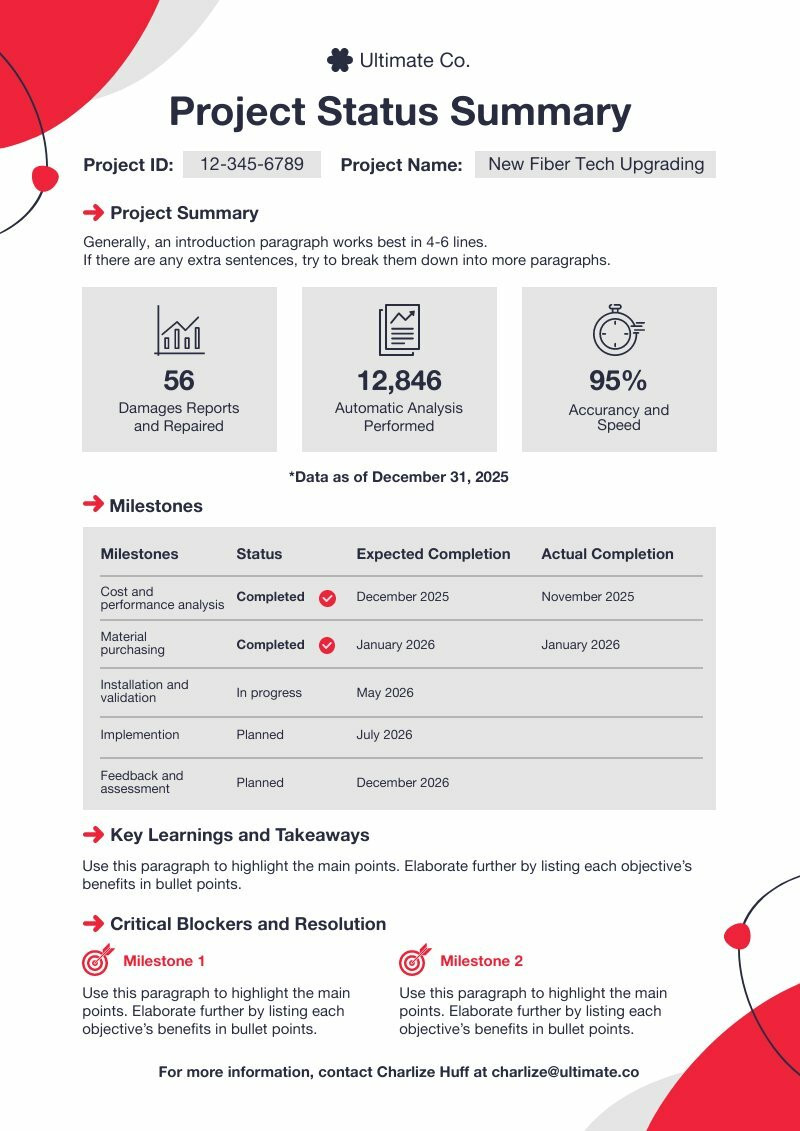
- Progress reports: These are reports used to easily track progress on a particular project or activity, and can be divided into daily, weekly, monthly, or quarterly progress reports.

- Feasibility reports: These are reports that assess the feasibility of a particular project or initiative, such as a new product or service.

- Executive Summary Reports: These reports provide a brief summary of a larger report in business management. They are typically used to provide key decision-makers with a quick overview of the report topic.

In addition to these report types, many companies also utilize business plan templates when developing new initiatives or strategies.
Specialized Business reporting examples
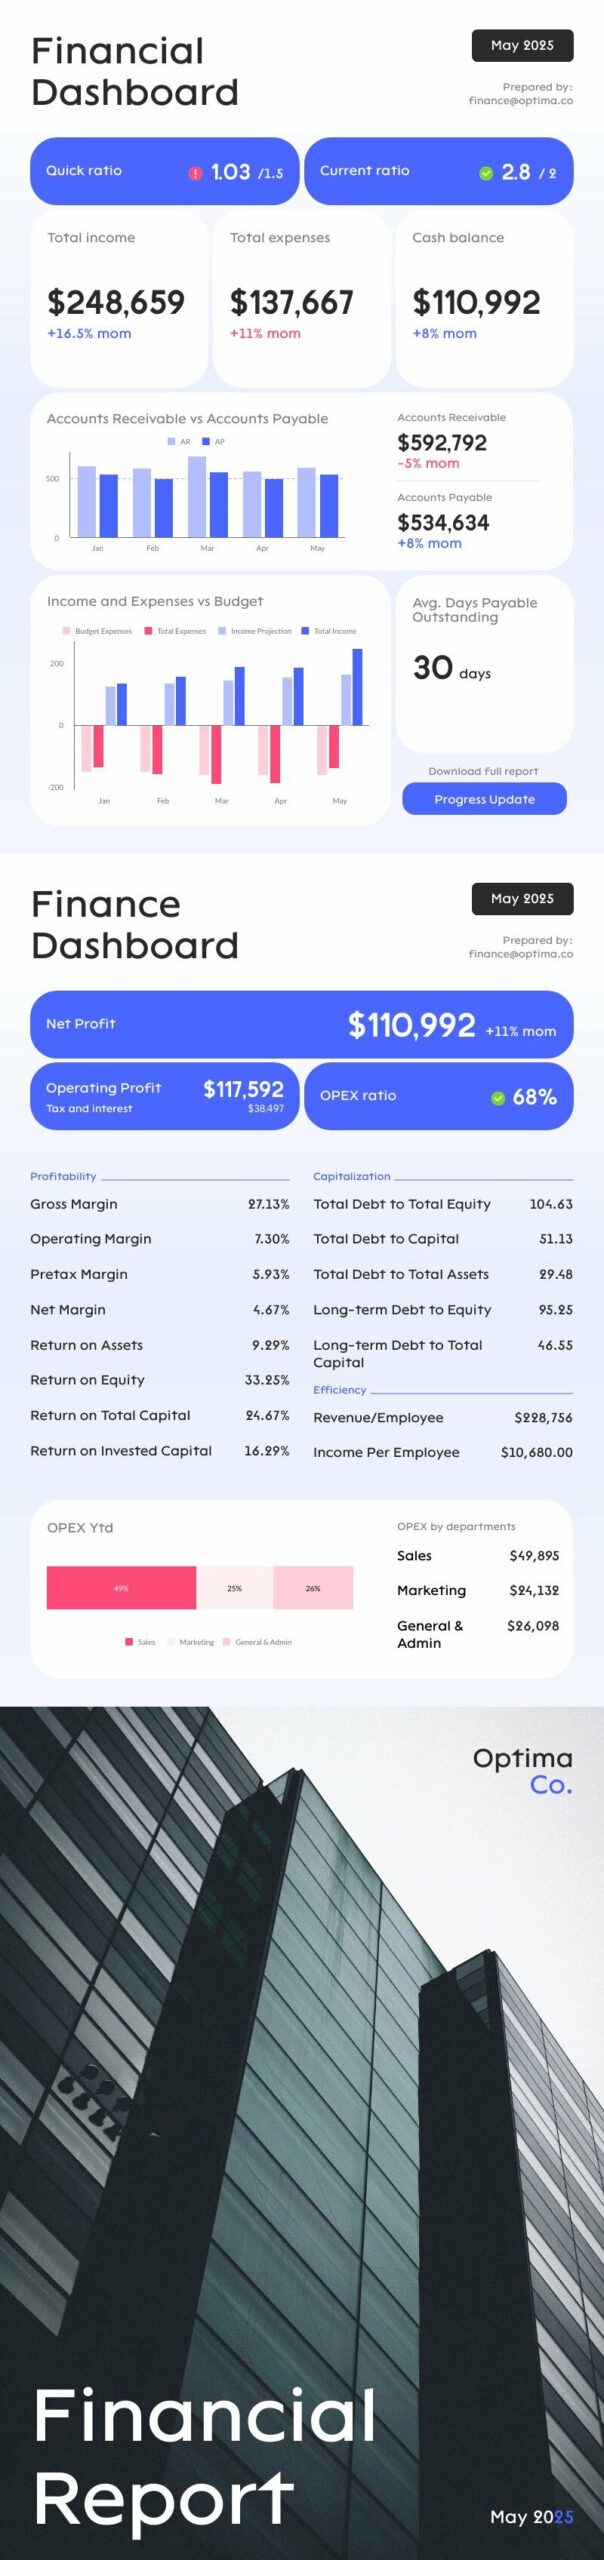
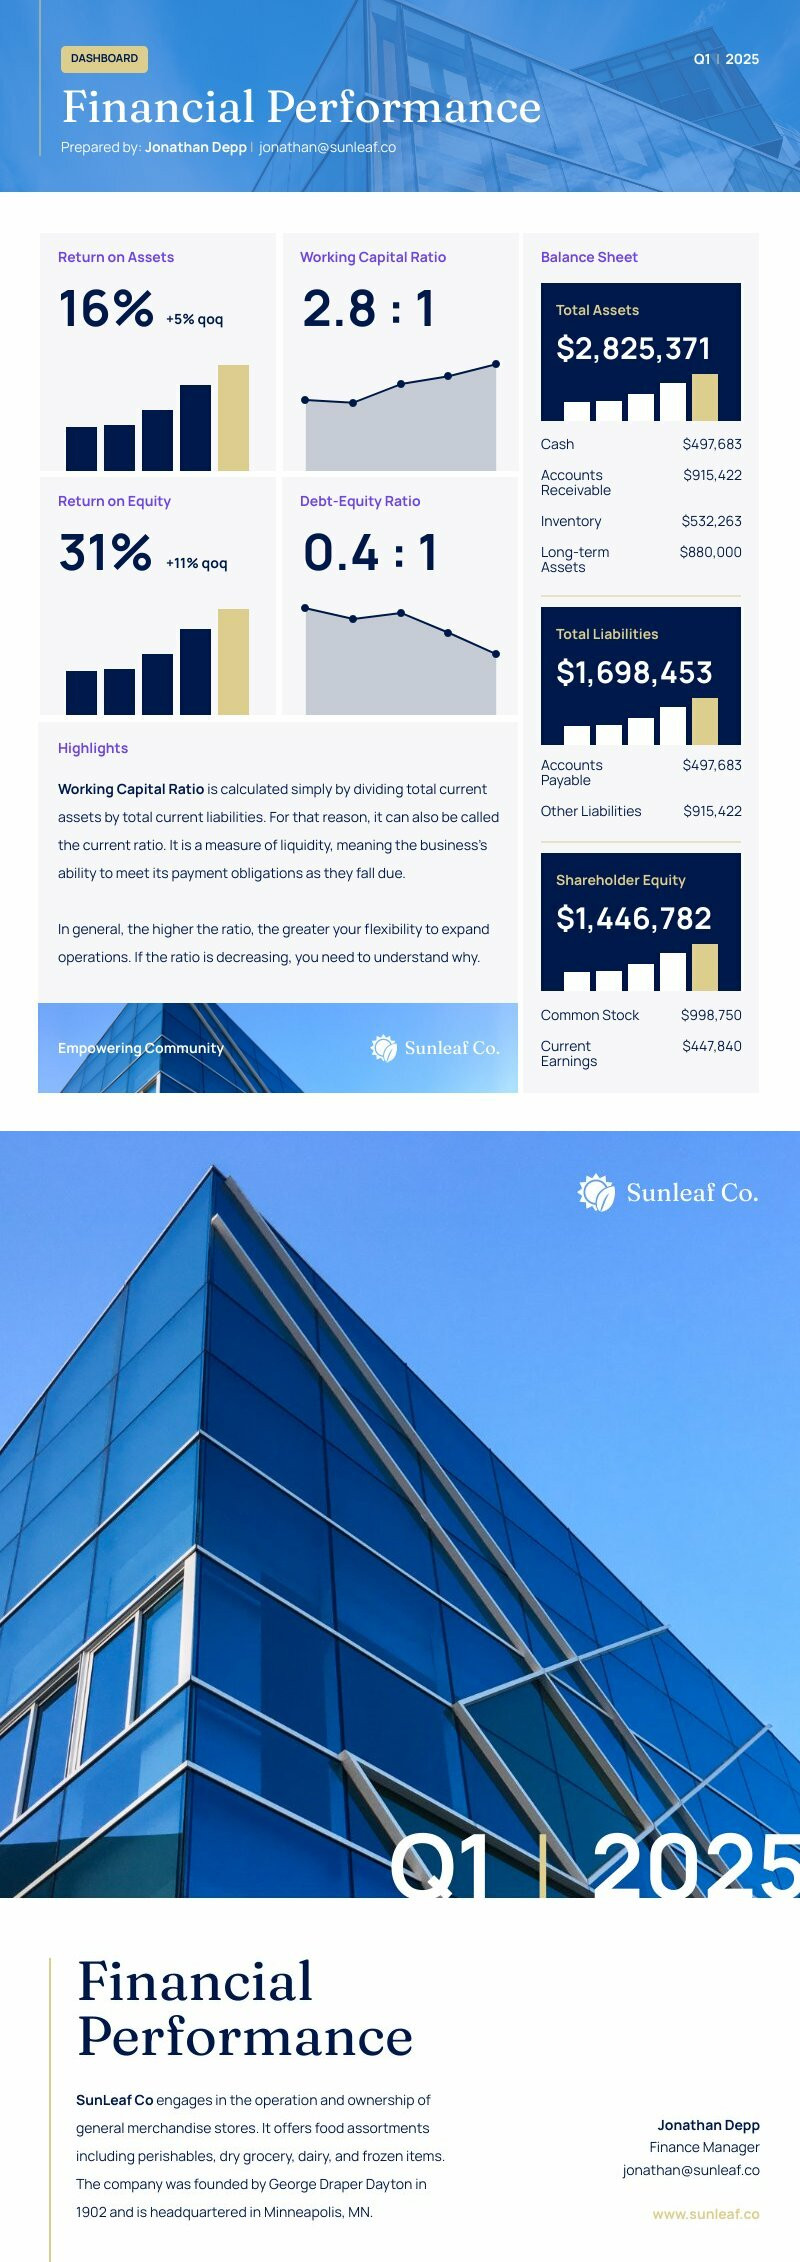
- Financial reports: These are reports that present financial information, such as balance sheets, income statements, and cash flow statements, which measure performance of the company.

- Annual reports: These are reports that provide an overview of an organization’s performance over the course of a year, including company goals, new insights, and average revenue.


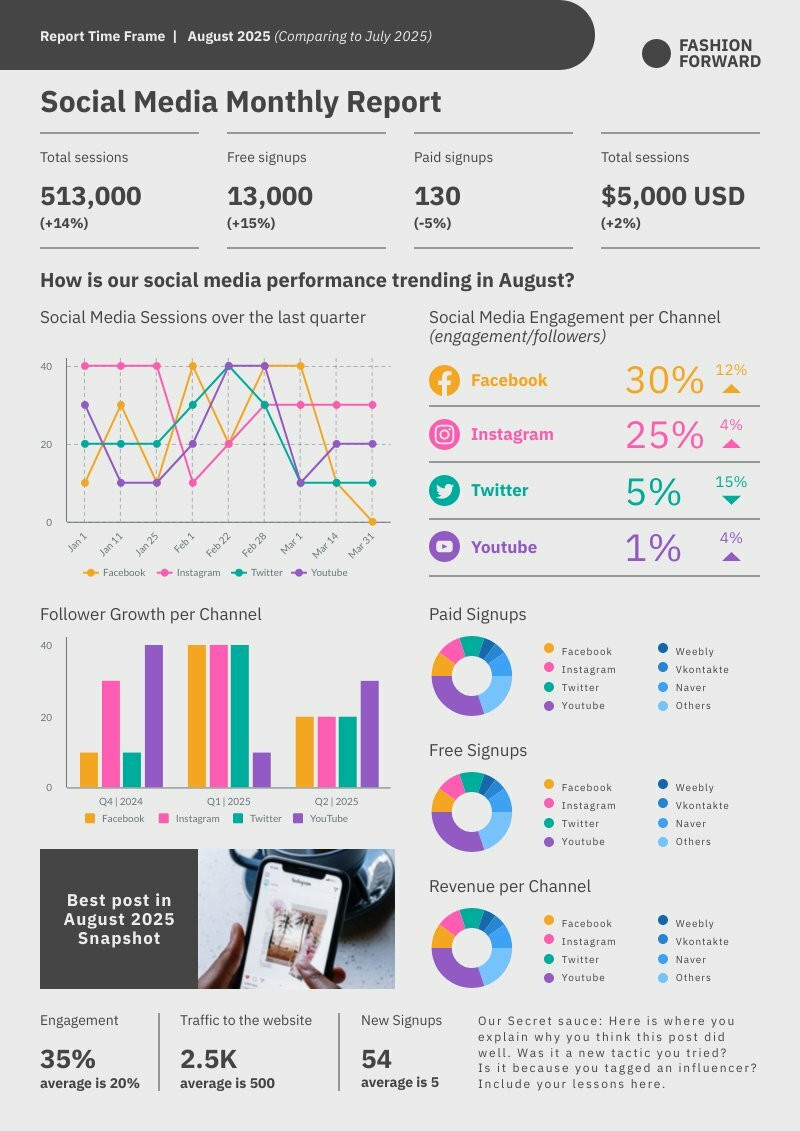
- Sales and Marketing Reports: These reports provide relevant information on sales and marketing activities, such as sales forecasts, customer overview demographics, marketing report and market research, typically created by sales rep.

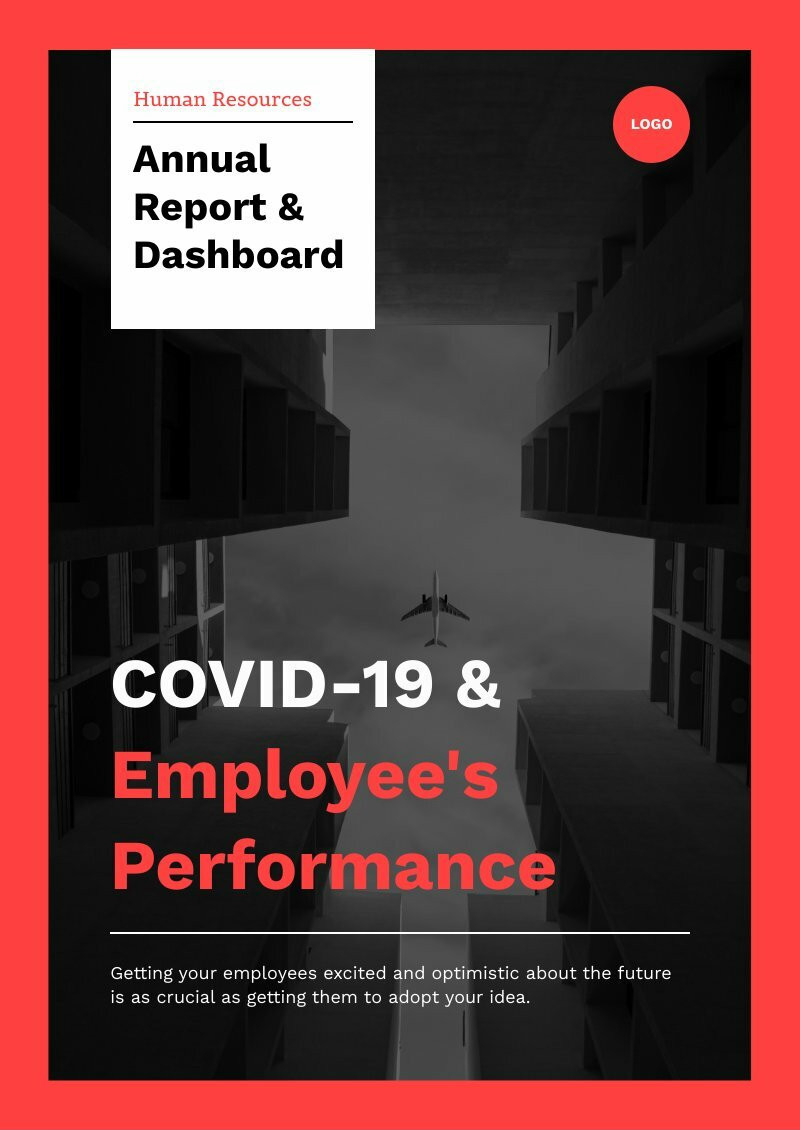
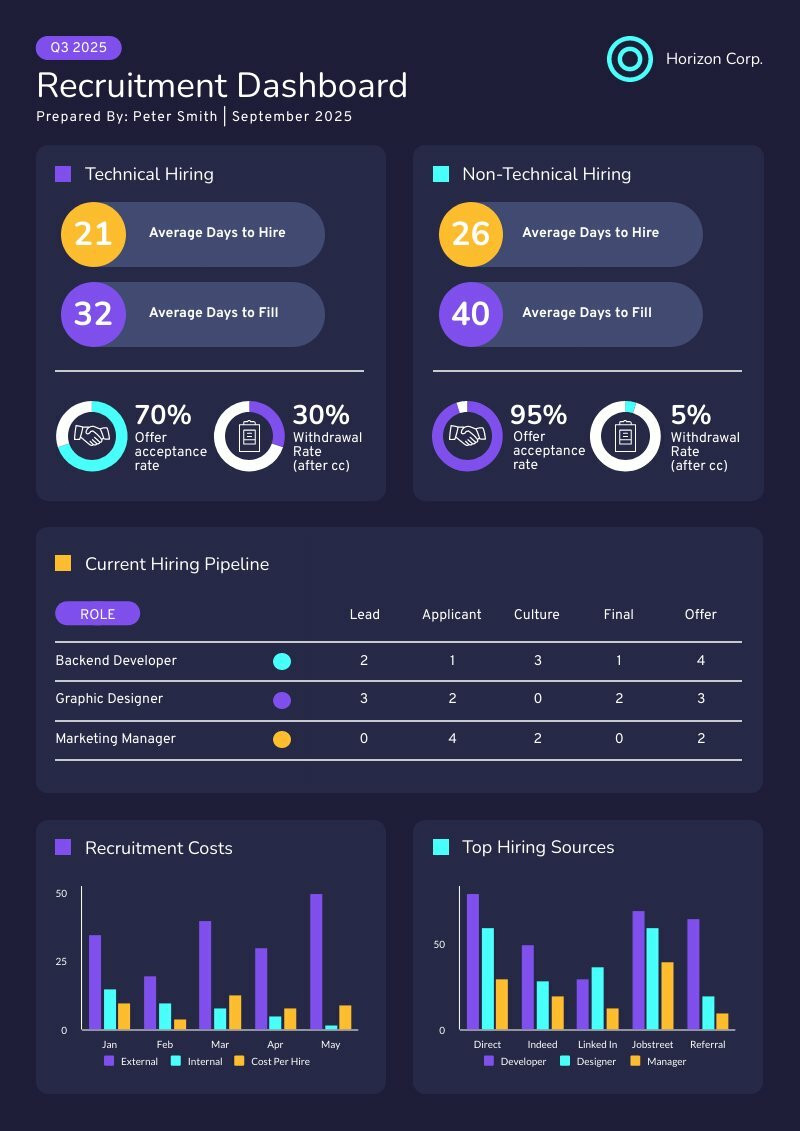
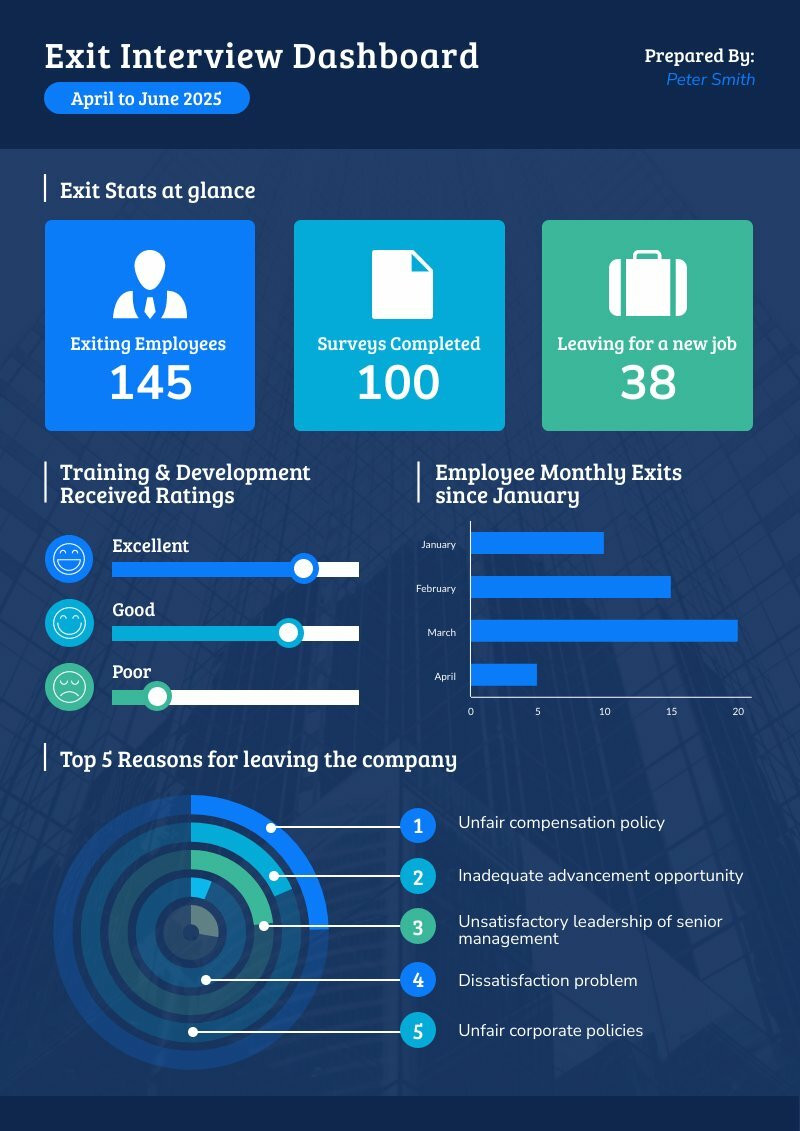
- Human Resources Reports: These reports provide information on employee-related matters, such as recruitment, training, and performance management.


- Incident Reports: These reports document workplace incidents, such as accidents, injuries, or security breaches. They may be used for legal or insurance purposes.
- Environmental Reports: These reports assess the environmental impact of a company’s operations. They may include information on energy consumption, waste management, and carbon emissions.


- Investigative reports: These are reports that investigate a particular issue, such as a workplace incident or accident.

Other reports
- Academic reports: This is an analytical report used in academic settings to convey research findings, such as lab reports, research reports, and case studies.


- Technical reports: These are reports that communicate technical information, such as engineering reports, scientific reports, and project reports. It may contain all the relevant explanatory reports and research methods.

What makes a great business report format?
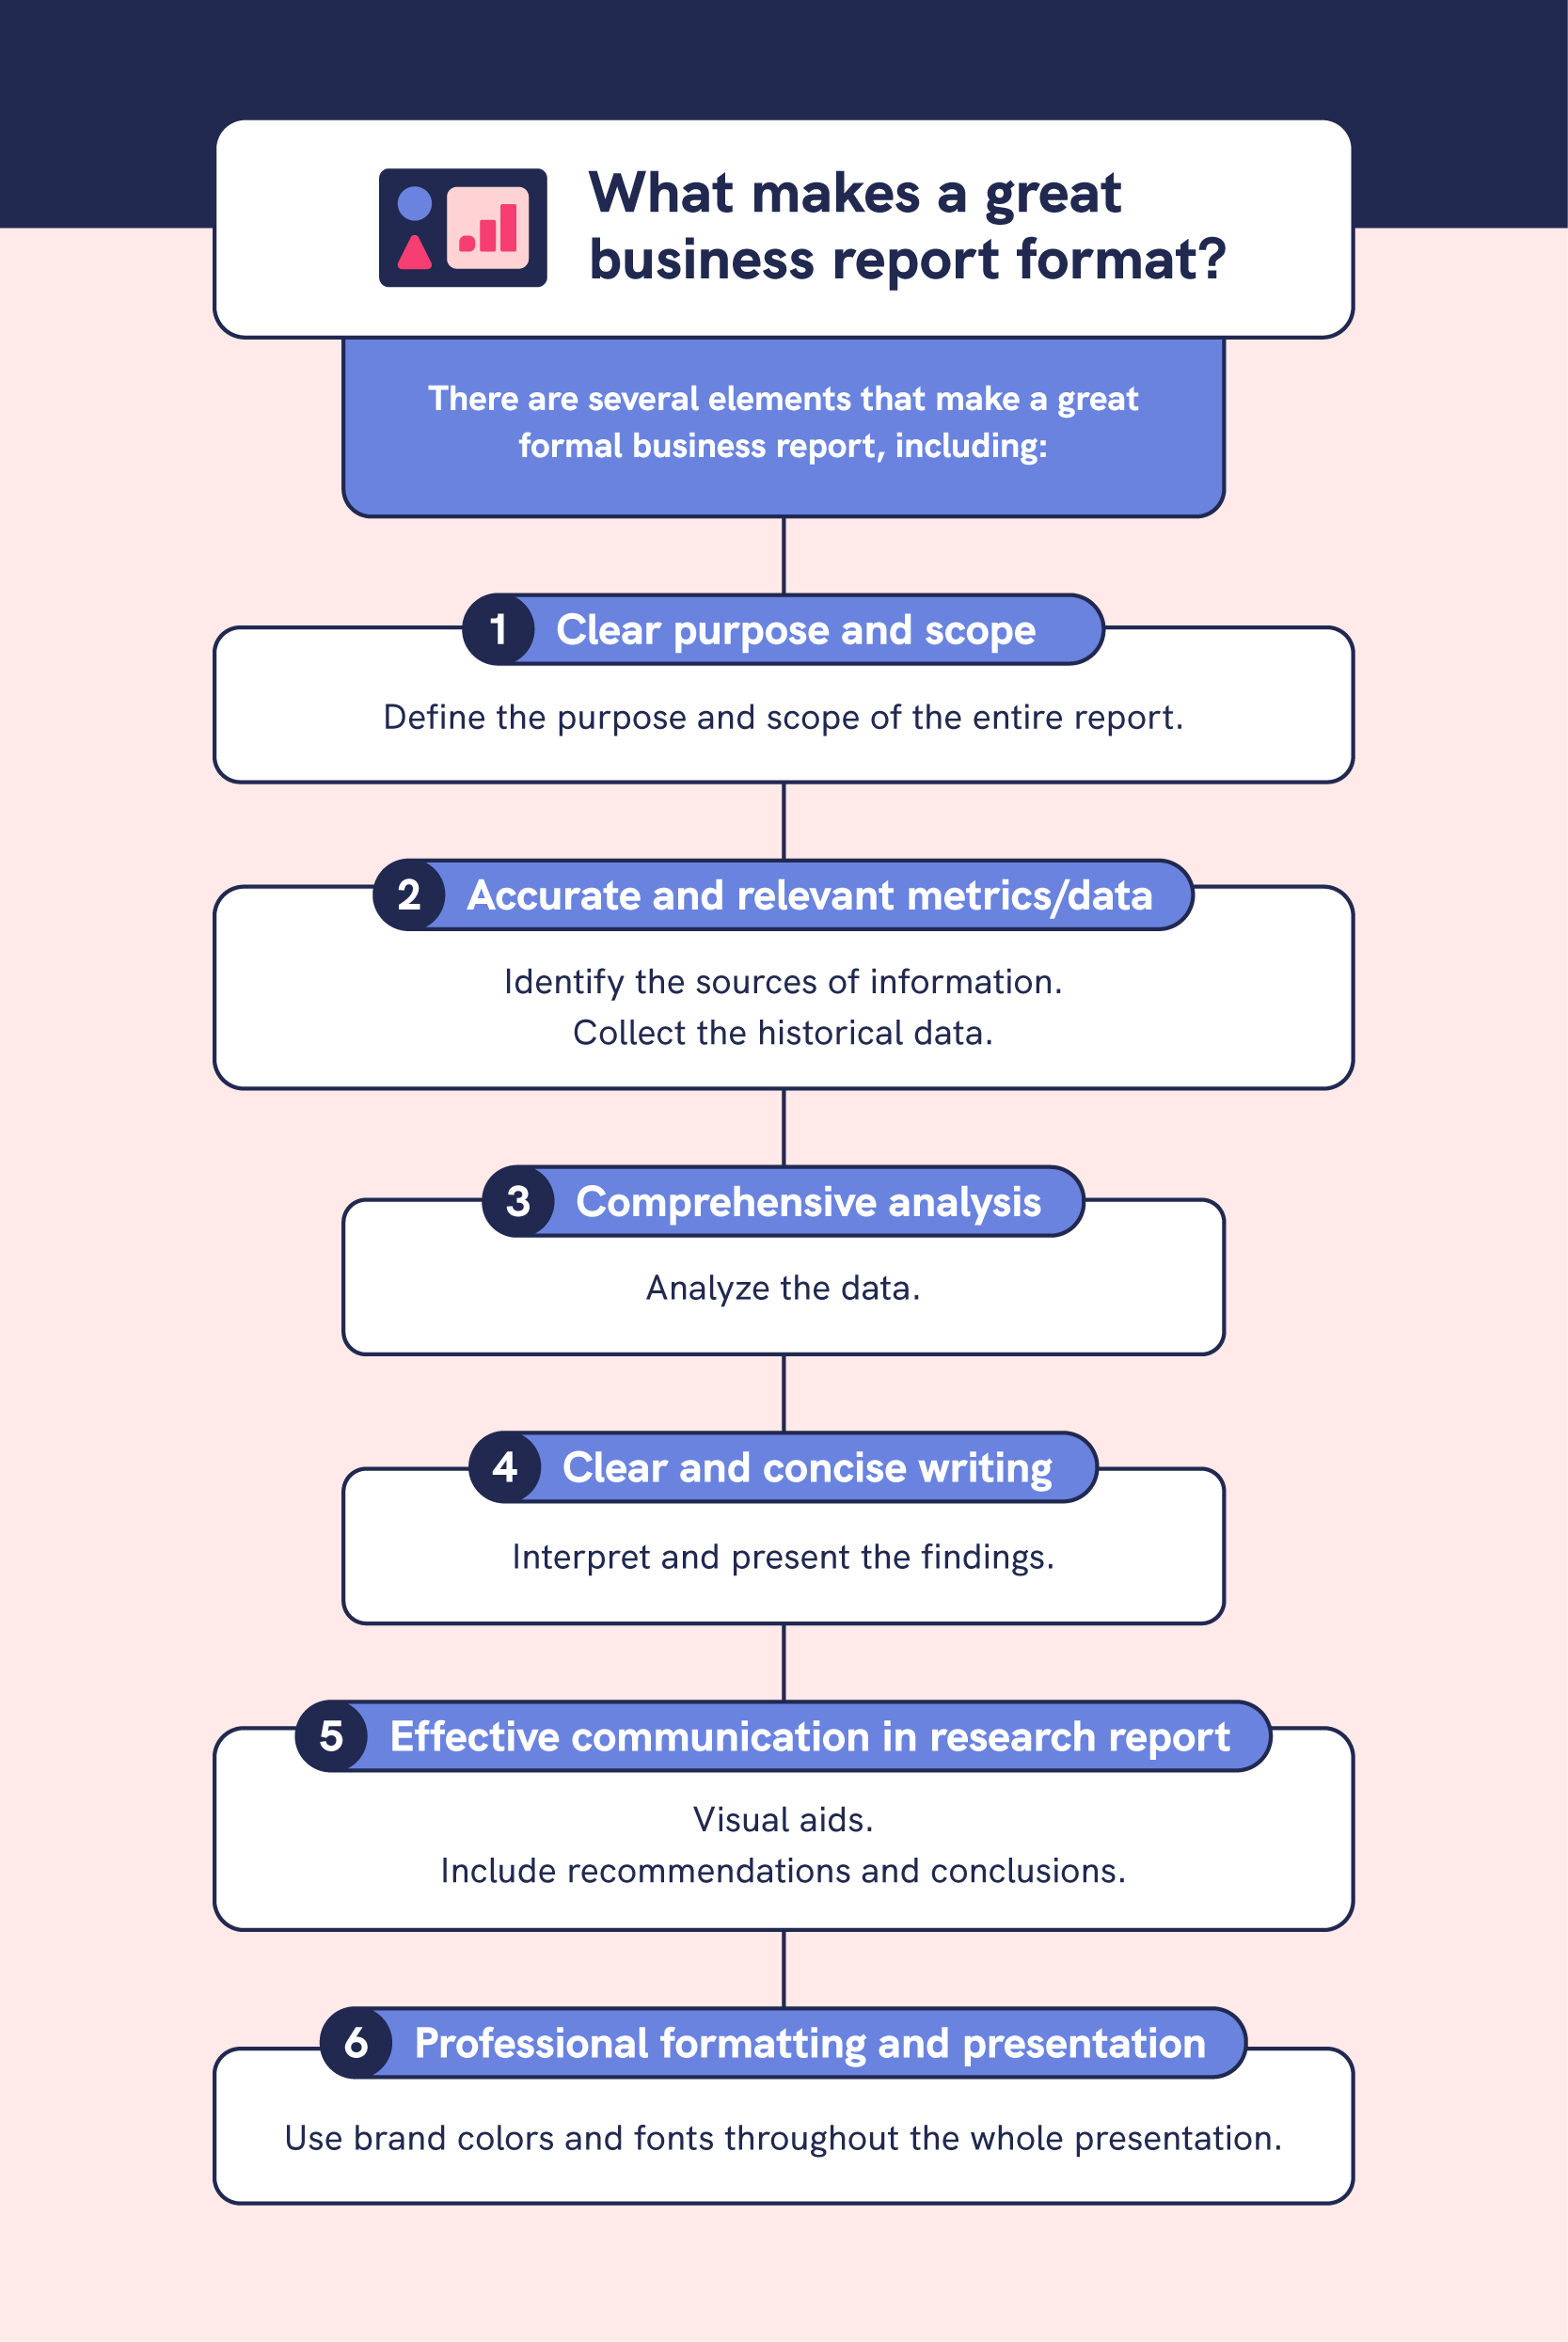
There are several elements that make a great formal business report, including:
Clear purpose and scope
A report can contain a lot of information, it is important not to lose the bigger picture. It should be easy to access the report’s main points through a table of contents at the introduction.
Define the purpose and scope of the entire report: Determine the objectives of the report and the information that needs to be collected to achieve those objectives.
Accurate and relevant metrics/data
Identify the sources of information: Determine where the critical information can be found. Sources can include primary sources such as surveys, interviews, and experiments, or secondary sources such as books, articles, and online databases.
Collect the historical data: Gather the necessary data by conducting interviews, surveys, experiments, analytical reports, or other means. Be sure to record and organize the data in a systematic and organized manner.
The gathering of relevant data is often time consuming. It would be good to collaborate on this process and assign multiple stakeholders different portions of the report so that the information gathering isn’t spent on analytical reports by one individual only. Piktochart has the ability to help you collaborate in teams specifically for this purpose.
Comprehensive analysis
Analyze the data: Once the data has been collected, conduct an in depth analysis to identify patterns, trends, and relationships. Use statistical tools, software, or other analysis methods to make sense of the data.
Go from big picture to small details. It is good practice to create an outline of the report and what should be communicated in official document before going into the actuals of putting the report together.
Break the analysis down into multiple pages. Use a page to convey one main point instead of cramming in multiple charts and figures.
Clear and concise writing
Interpret and present the findings: Draw conclusions based on the data and present the findings in a clear and organized manner. Use charts, tables, graphs, and other visual aids to help convey the factual information.
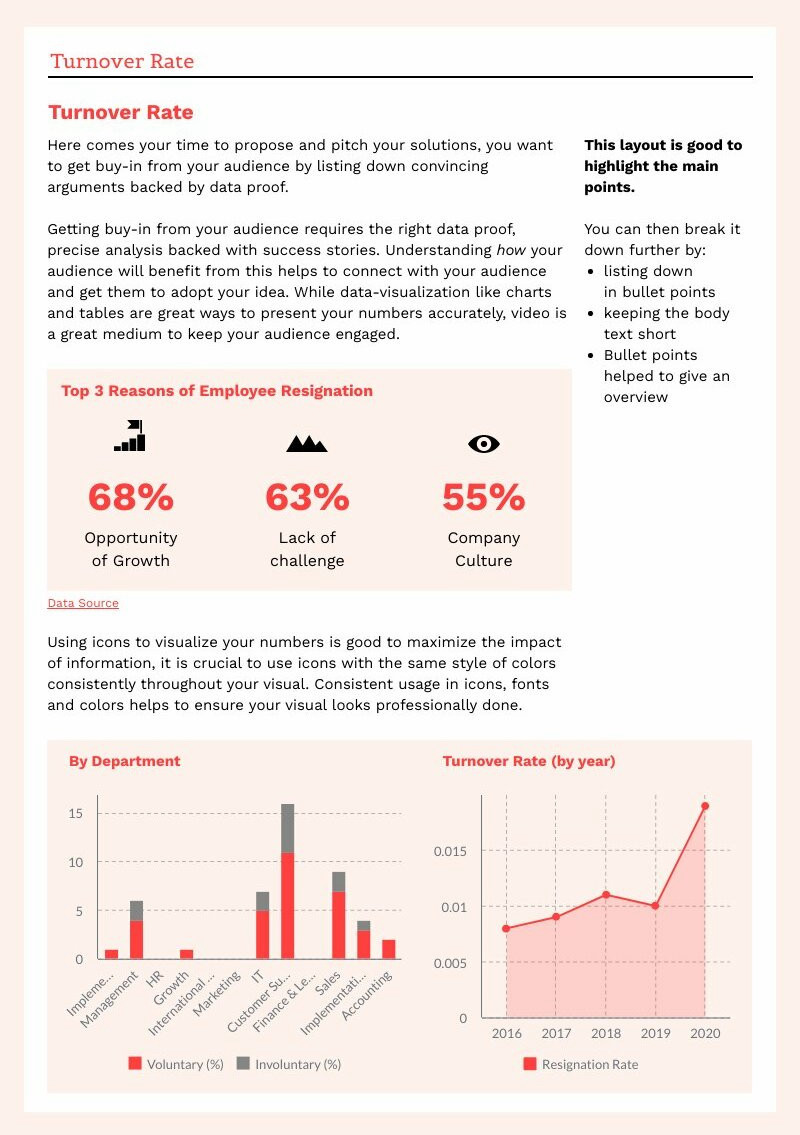
For example, one may opt for the use of bullet points sparingly and opt to make the sentences shorter and without jargon. A visual layout of two columns may also help in some cases.
Effective communication in research report
A report can be consumed digitally or via print. If it’s consumed digitally e.g. in a single dashboard, you can provide a TLDR summary or explanatory report for the readers via email so that they would know what to expect.
Visual aids
The best option here is to go with diagrams, images, tables and charts that help to convey the main point of a particular page.
If the report is hosted online, it is also possible to include other videos or audio content to get the viewers interested.
Recommendations and conclusions
Revise and finalize the report: Review and revise the report to ensure that it is accurate, complete, and well-organized. Be sure to proofread for spelling errors, grammar mistakes, and punctuation.
It is important to address the concerns that the key decision maker has about the progress report and aid decision making process. The language and tone of the report should always be future-looking and positive. You can do this by balancing potential risks and key opportunity areas.
Professional formatting and presentation
Aim to use brand colors and fonts throughout the whole presentation. These “tiny” signals give the impression that the report has been professionally designed.
What are the five main parts of a business report?
Business reporting typically includes:
- Introduction that provides background information. The title and table of contents can go here. Occasionally, it also includes some brief opening remarks from the leadership team.


- Main body that presents the data or findings. This can be broken down into several pages and it is best to present one salient piece of information per page. The aim is not to reduce the number of pages, but to go for concise writing so that there is a strong message per page.

- Conclusion that summarizes the key points.

An important part of conclusion is recommendations for further action. A report would be incomplete if it does not bear any future-forward messages for the business/activity.

- Appendices
While there is no specific format that has to be followed, Piktochart has some great business report examples for you to get started. Sign up to access more professionally designed templates of presentations, infographics, social media graphics and more.
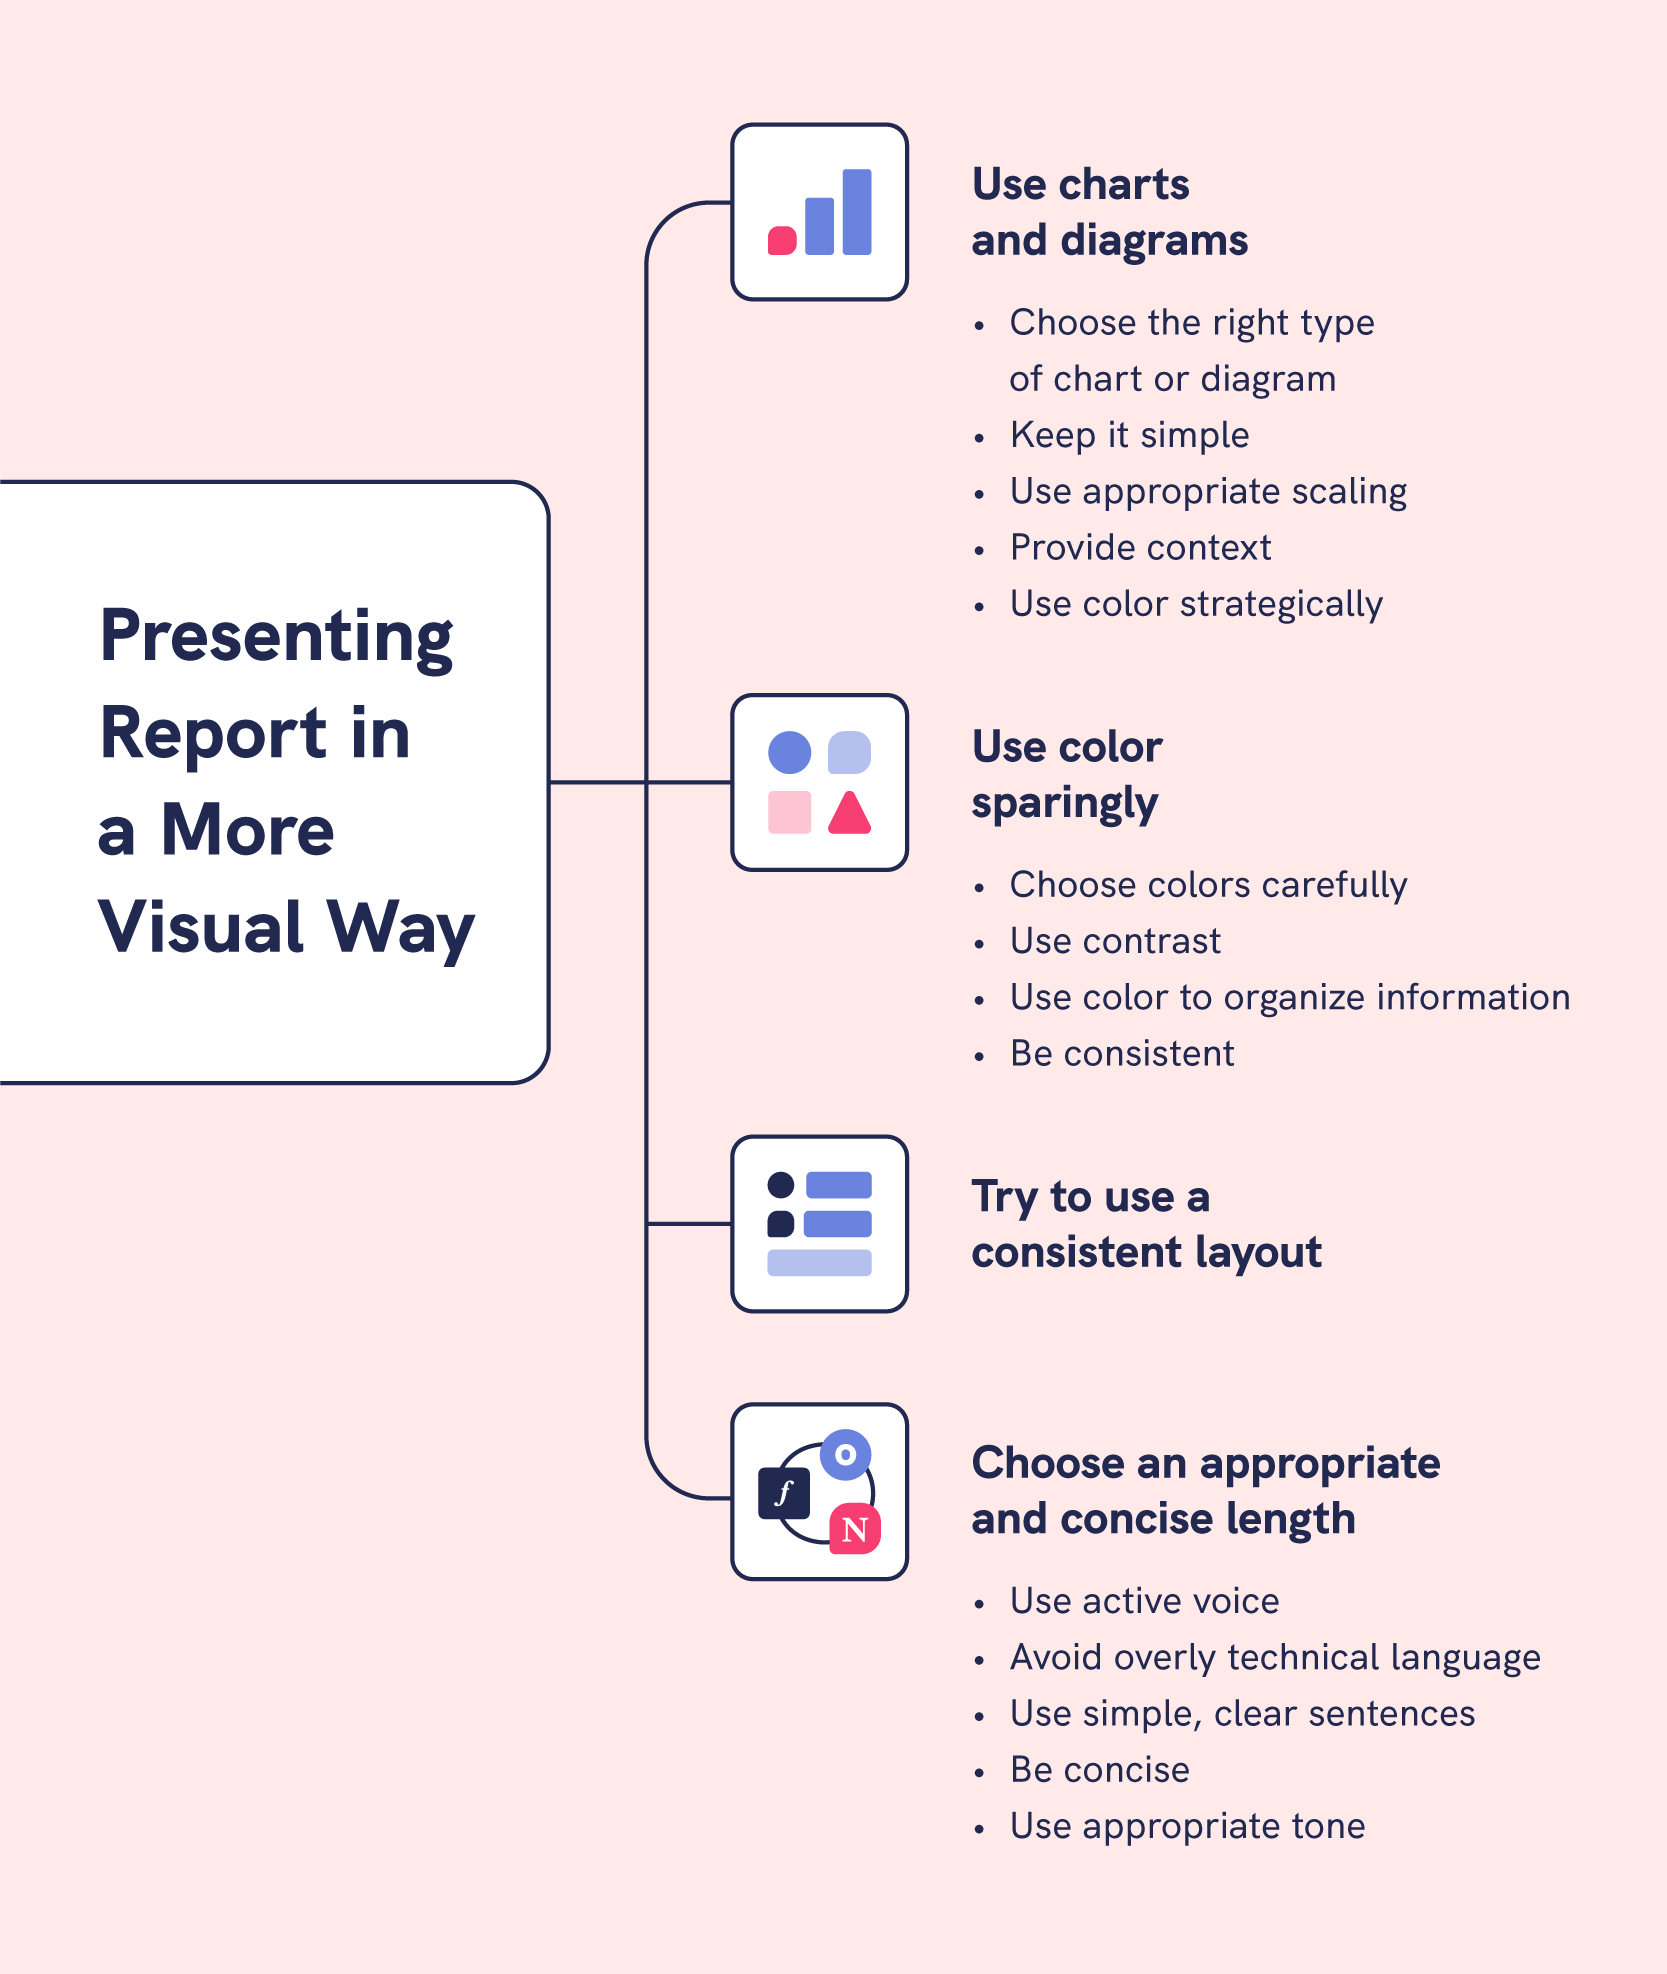
How to present the report in a more visual way?
Use charts and diagrams
Visual aids such as pie charts, bar graphs, and line graphs can help to convey complex information in a clear and concise manner.
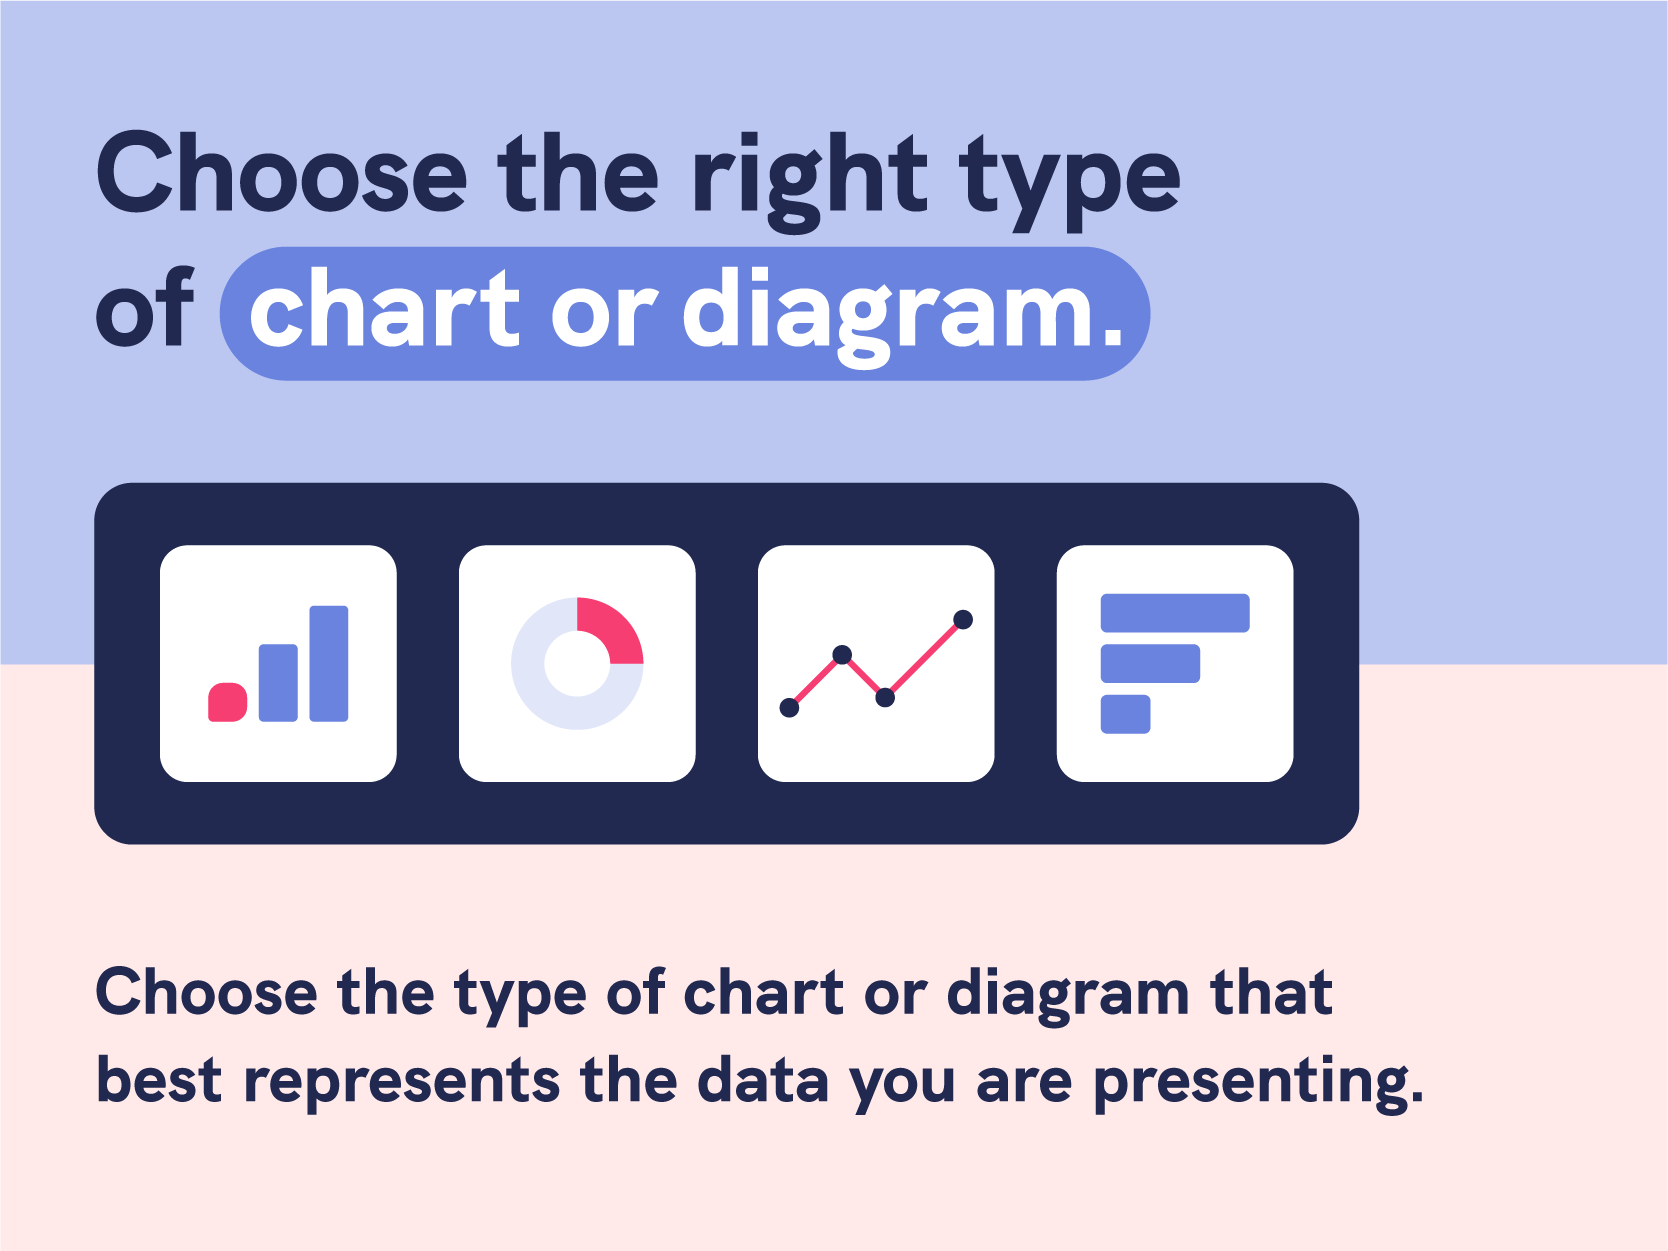
Choose the right type of chart or diagram
There are many different types of charts and diagrams available, including bar charts, pie charts, line graphs, scatter plots, flowcharts, and more. Choose the type of chart or diagram that best represents the data you are presenting and is most appropriate for your audience.
Keep it simple
While charts and diagrams can be useful for presenting complex information, it’s important to keep them simple and easy to understand. Avoid cluttering your chart or diagram with too much information, and use clear and concise labels and titles.
Use appropriate scaling
When creating a chart or diagram, it’s important to use appropriate scaling to ensure that the data is accurately represented. Make sure that the scale of the chart or diagram is appropriate for real value of the data you are presenting, and avoid distorting the data by using uneven scales.
Provide context
Charts and diagrams can be difficult to interpret without proper context. Make sure to provide context for your data by including clear and concise explanations of what the chart or diagram represents and how it relates to the rest of the report.
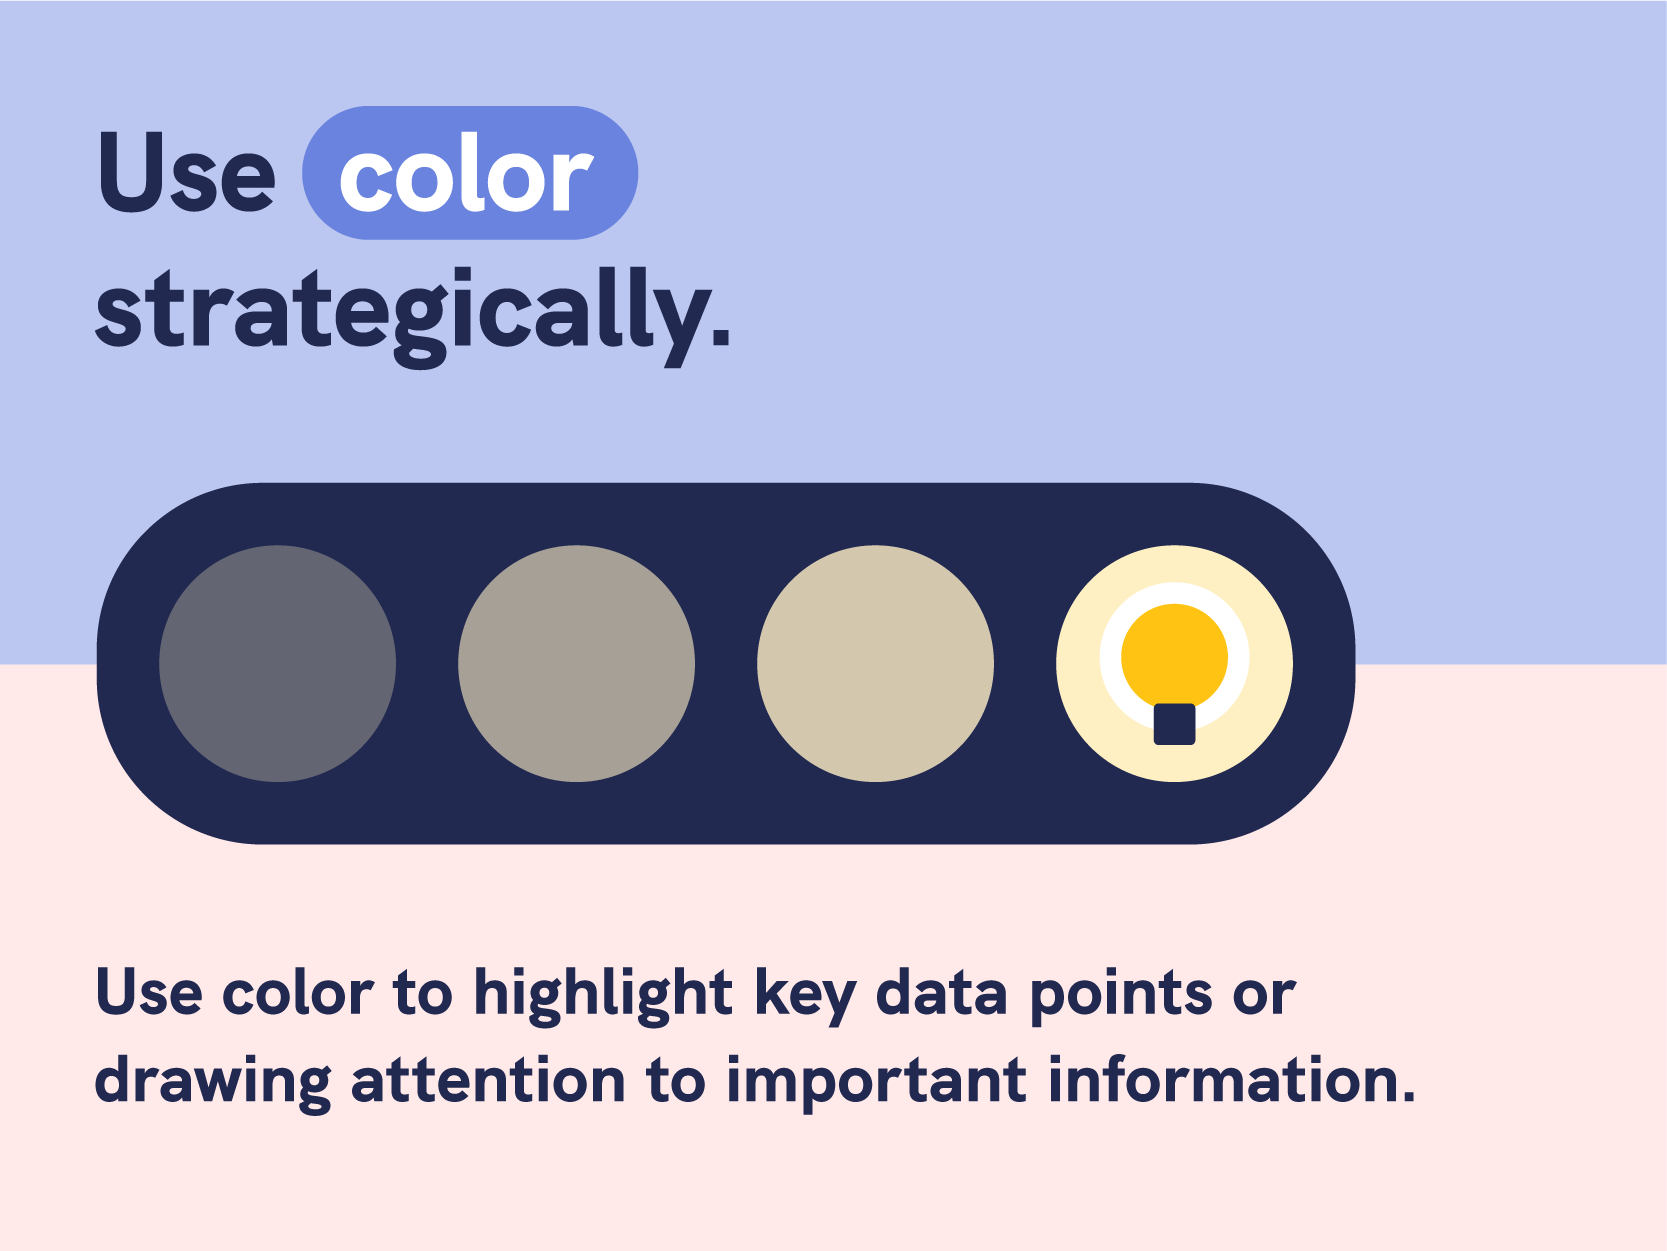
Use color strategically
Color can be a powerful tool for highlighting key data points or drawing attention to important information. However, it’s important to use color strategically and sparingly to avoid overwhelming your audience.
Use color sparingly
Color can help to highlight important information and make the report more visually appealing.
While color can be a powerful tool for emphasizing important information, using too much color can be overwhelming and distracting. Use color strategically to draw attention to key data points, headings, or other elements that you want to emphasize.
Choose colors carefully
When selecting colors, consider the target audience and purpose of the report.
Stick to a color scheme that is appropriate for the subject matter and aligns with the company’s branding. Avoid using too many bright or bold colors, which can be jarring to the reader.
Use contrast
One of the most effective ways to use color in a business report is to create contrast between different elements. For example, use a bold color for headings or subheadings to make them stand out from the surrounding text.

Use color to organize information
Color can be a useful tool for organizing information and making it easier to scan. Consider using color to create sections or categories within the report, or to distinguish between different types of data.
Be consistent
To avoid confusion, it’s important to be consistent in your use of color throughout the report. Use the same colors for the same types of information, and make sure that the colors you use are consistent with the company’s in house format or branding guidelines.
Use a consistent layout
Using a consistent layout throughout the report broken down by headings and subheadings can help to make it more visually appealing and easier to follow.
A single-column format is often used because it is easier to read and allows for a more logical flow of information. It also allows for the use of larger fonts and more white space, which can help improve readability.
In some exceptions, some reports may use a multi-column layout, typically with two columns, if they contain a large amount of data or if the report is intended to be read on a digital device, such as a tablet or computer screen. A multi-column format can help improve the organization of the data and make it easier to compare information across different sections. Business infographics typically follow a consistent layout to ensure clarity and visual appeal.
Choose an appropriate and concise length
Do not cram too much information within a single page. Here are some more helpful tips on the language that you can use for business reports.
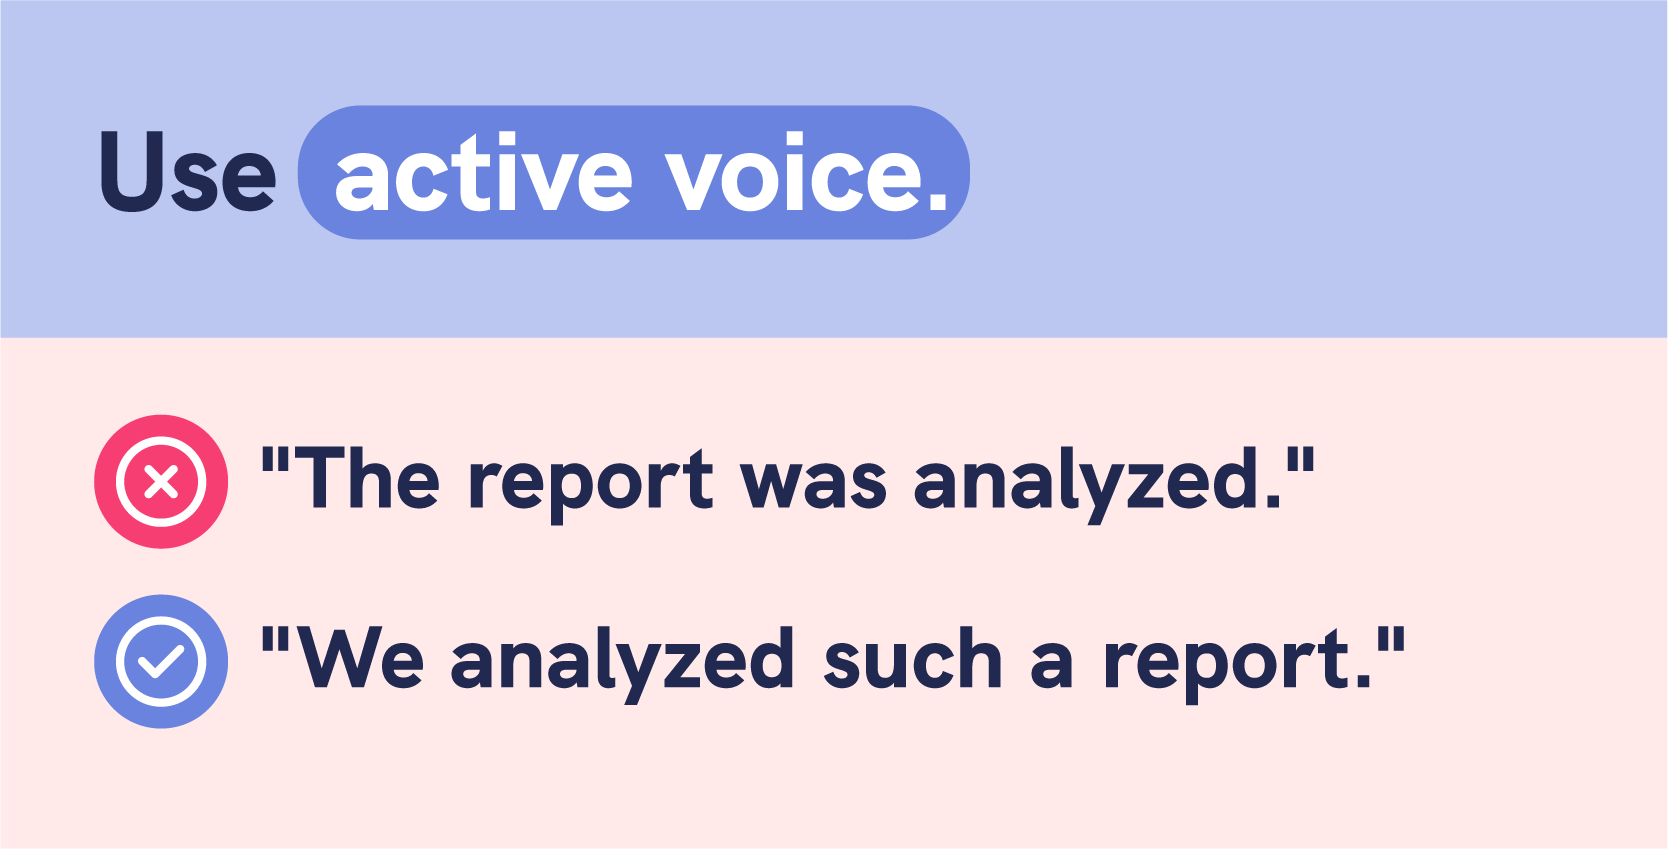
Use active voice
Active voice makes your writing clearer and more concise, and it can help you communicate your ideas more effectively.
For example, instead of writing “The report was analyzed,” write “We analyzed such a report.”
Avoid overly technical language
While some technical language may be necessary, avoid using jargon or technical terms that your readers may not be familiar with. If you must use technical terms, provide clear definitions or explanations.
Use simple, clear sentences
Avoid long, convoluted sentences that are difficult to understand. Instead, use simple, straightforward sentences that clearly communicate your ideas.
Be concise
Don’t use more words than necessary to convey your message. A sentence should not contain more than 20-30 words (unless you’re writing a technical or academic report).
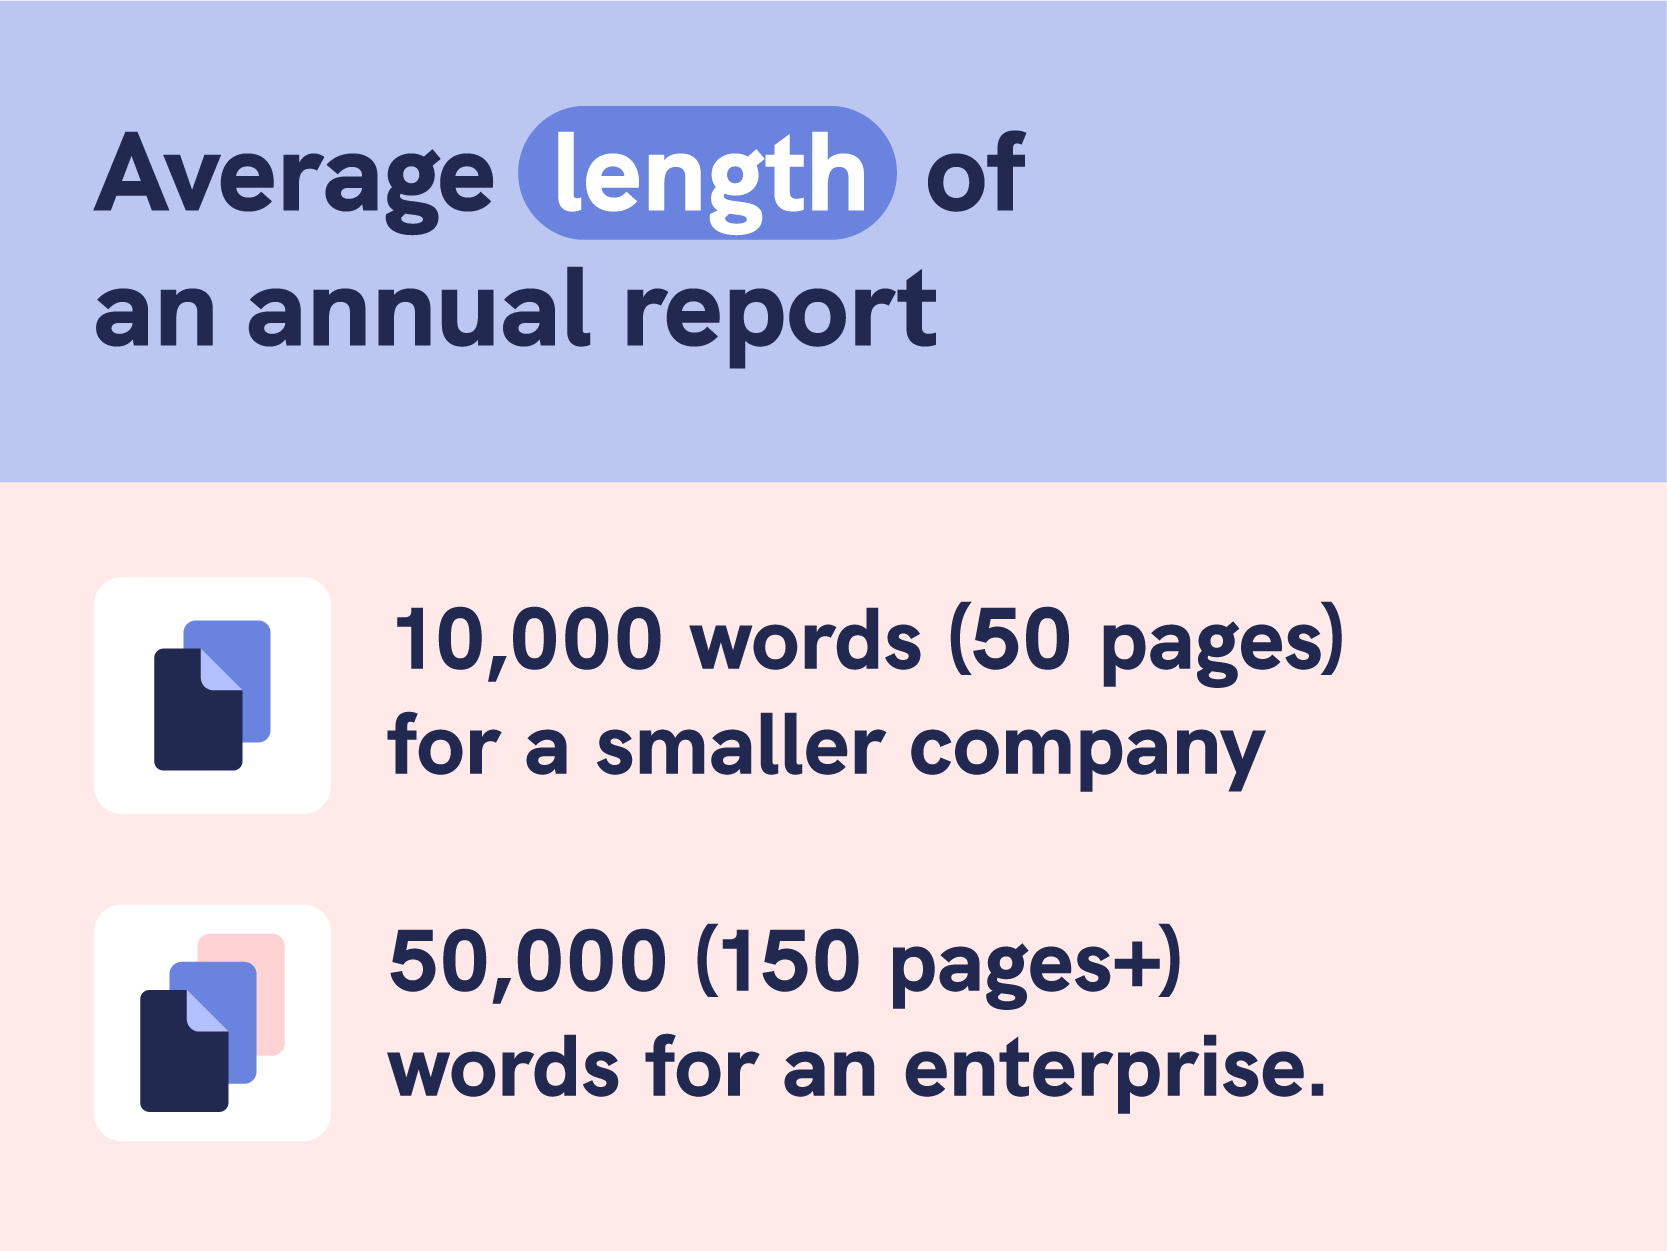
The average length of an annual report is 10,000 words (50 pages) for a smaller company and 50,000 (150 pages+) words for an enterprise. Typically, not every page contains text, as some may have more charts/tables.
Use bullet points, tables, and graphs to help convey your ideas concisely.
Use appropriate tone
The tone of your report should be professional and objective. Avoid using emotional language or language that is overly informal.
For example, “I’m totally excited to announce that our new product is going to blow the competition out of the water! It’s absolutely amazing and customers are going to love it.”

This sentence uses informal language (“totally excited”) and emotionally charged language (“blow the competition out of the water,” “absolutely amazing,” “customers are going to love it”) that may not be appropriate for a business report.
Ultimately, the language you use in your business reports should be tailored to your audience and the purpose of the most professional business report itself. Consider who will be reading the formal business report and what information they need to know, and adjust your language accordingly.
And now, over to you!
For more information, you can check out a step by step guide to create your business report sample. You can also browse our template gallery and select a template to get started.
Visualize Your Business Reports
Check out Piktochart’s business report template gallery to get you started!
Browse Templates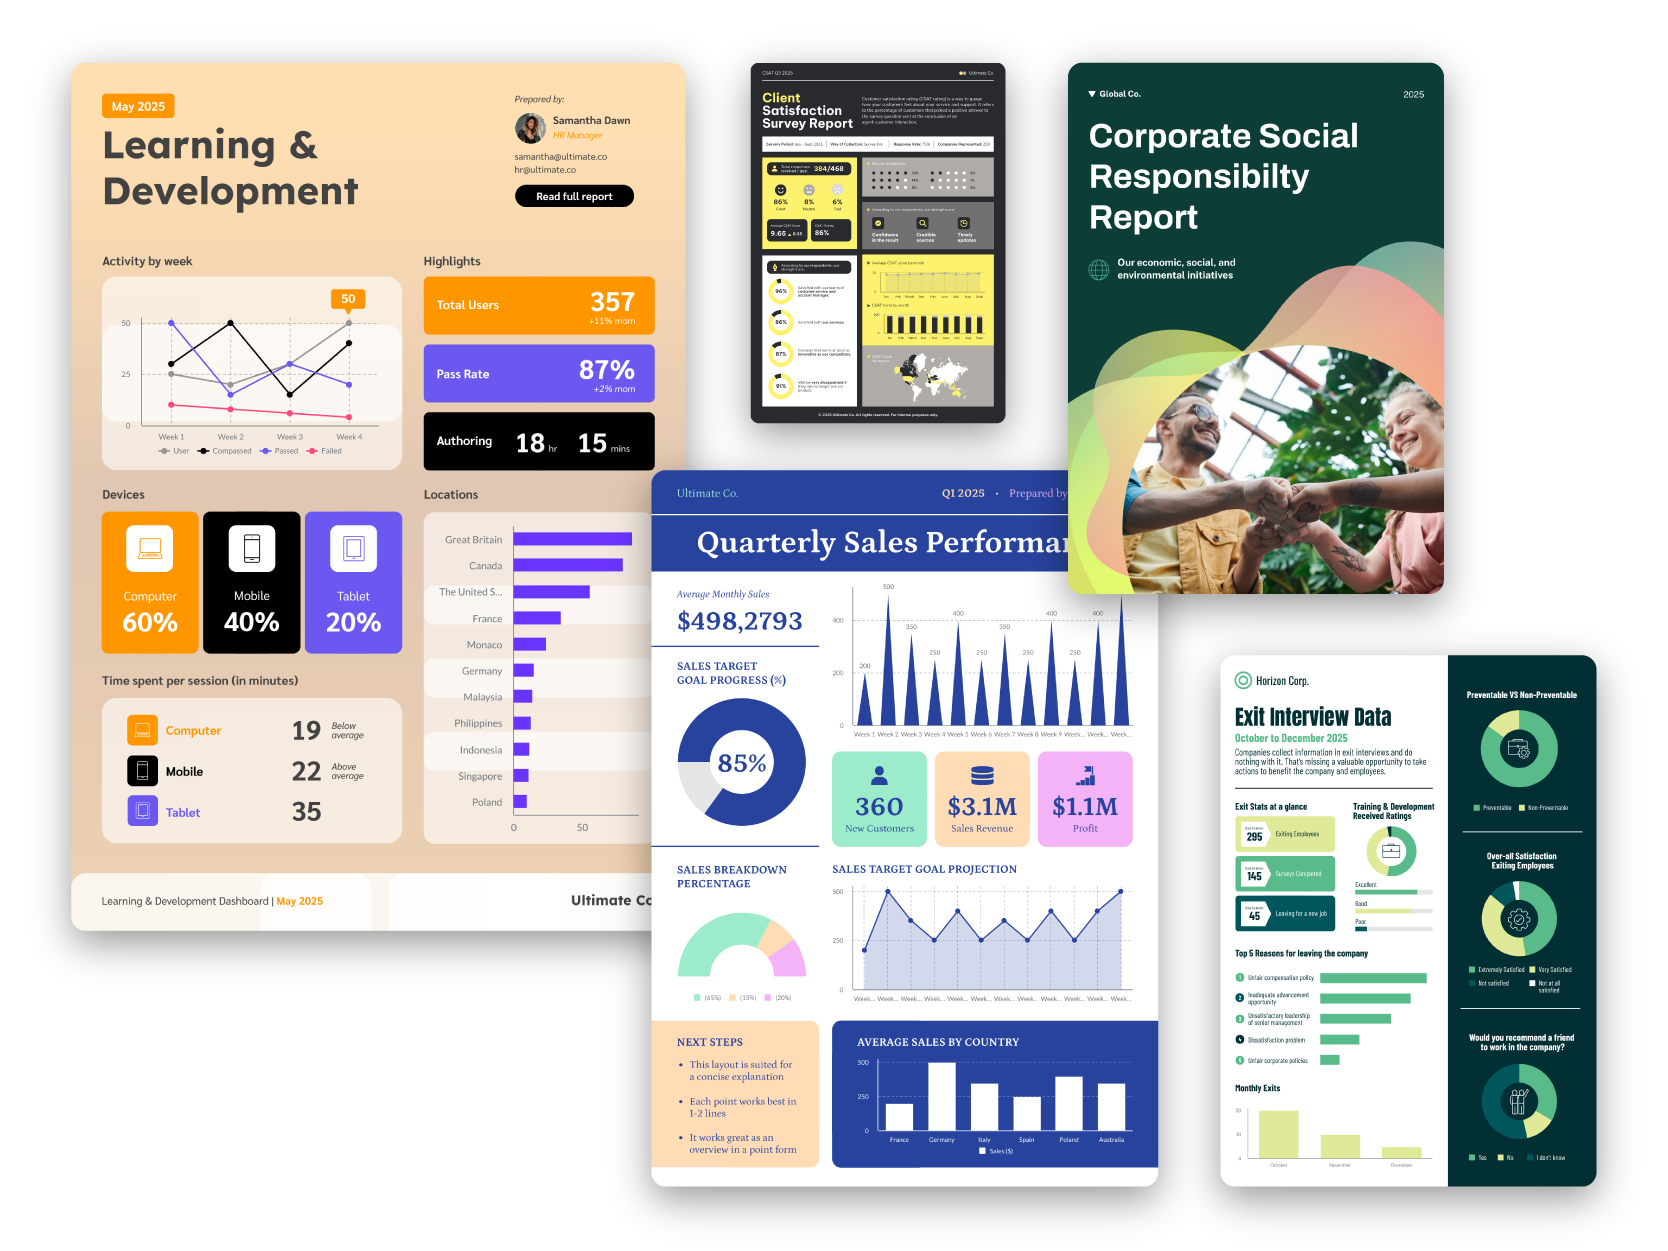
CTA: Check out Piktochart’s business report template gallery to get you started! https://pikto.wpstaging.uk/templates/reports/