Ever felt lost in a complex project and struggled to grasp the big picture? What if there was a way to map out all the moving parts and their relationships at a glance?
You might want to start with a clear vision using a context diagram. As a simple visual tool, context diagrams are like maps (but for processes!) and provide a high-level snapshot of a system.
Below, we’ll explore context diagrams and explain when they’re most useful, their limitations, and how they compare to data flow diagrams. You’ll also get examples and expert tips to ensure your context diagrams are top-notch.
Pro tip: Get your free Piktochart account before you scroll down. This way, you can use Piktochart’s free online diagram maker and diagram templates to build a custom diagram in minutes right in your browser.
What are context diagrams?
A context diagram is a simple visual representation of how a system interacts with its environment. It’s like a straightforward snapshot of your system’s place in a larger ecosystem.
Think of a context diagram as if you’re planning a road trip. You know where you’re starting and where you want to end up, but you need a map to figure out the route and what interesting places you might pass along the way. A context diagram is like a crude version of that map.
Before you start packing and mapping out your route, you need to figure out the big picture:
Where are you starting from? (Your home city)
Where are you going? (Your destination city)
What’s the general area you’ll be traveling through? (States, countries, etc.)
What are the major roads or highways you might use? (Interstates, national routes, etc.)
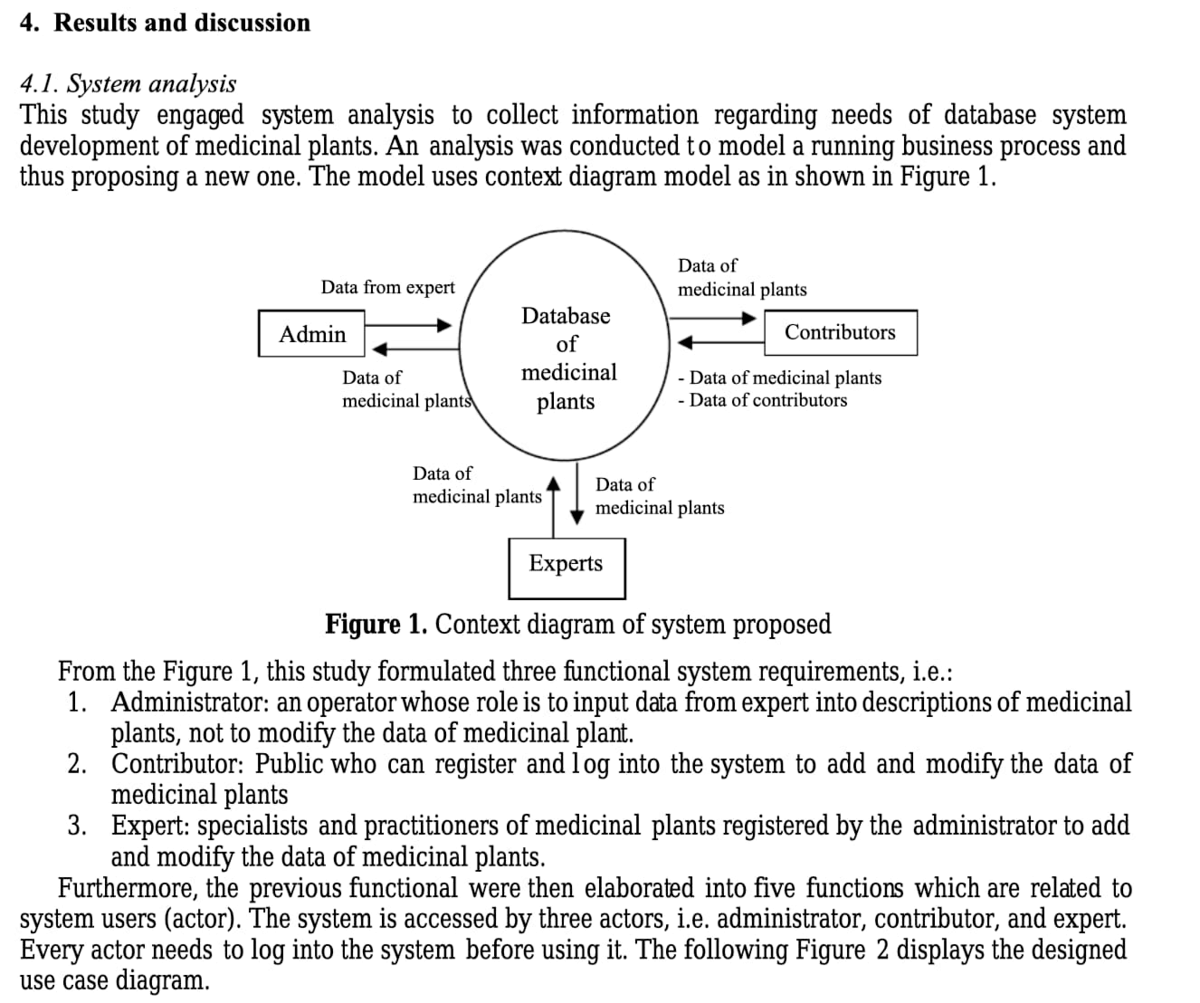
The example below shows a proposed context diagram for designing a web database application for local medicinal plants in Gorontalo, Indonesia.
Context diagrams are also known as Level 0 diagrams
Context diagrams often referred to as ‘Level 0’ diagrams, serve as the foundation for more detailed system visualizations.. Think of them as the zoomed-out view of your project map. Just like you can zoom in on a map to see more details, you can break down a context diagram into lower-level diagrams that show a system’s internal workings. These lower-level diagrams are labeled level 1, level 2, and so on, with each level providing more granularity.
Key elements of a context diagram
The next time you’re looking at a context diagram, look for the following basic elements:
1. The system itself
This is the main focus, like your road trip destination. A single process or entity at the center of the diagram represents the system. It could be a software application, a website, a business process, or any other system you’re analyzing.
Example: In an eCommerce context diagram, the central system might be ‘Online Shopping Platform.
2. External entities
These are things outside the system that interact with it, like the cities you’ll pass through on your way. If you’re creating software, they could be your users, other systems, organizations, or even external data sources.
Example: In an eCommerce context diagram, external entities might include “Customers,” “Payment Gateway,” and “Shipping Partners.”
3. Relationships or data flows
Relationships show how the system and external entities connect, like the roads you’ll take. Also known as data flows or flow lines, these are the arrows that connect your system to the external entities and indicate the direction of information exchange.
Example: In an eCommerce system, a data flow could be “Order Information” flowing from “Customers” to the “Online Shopping Platform,” or “Payment Confirmation” flowing from the “Payment Gateway” back to the platform.
Data flows may represent the following:
Inputs: The information or data flowing into your system from external entities.
Outputs: The information or data generated by your system and sent to external entities.
Bidirectional communication: The back-and-forth exchange of information between your system and external entities.
As you trace the data flows, you’ll understand what information your system needs to function, what it produces, and how it interacts with the ecosystem around it.
What is the difference between a DFD and a context diagram?
Context diagrams and data flow diagrams (DFDs) are both crucial tools for system visualization, but they serve distinct purposes. Let’s explore their key differences to help you choose the right tool for your needs.
Context diagrams
Simplified view: A context diagram offers a more simplified view than data flow diagrams. It focuses on its main components and interactions with external entities.
Example: A context diagram for an online store might show the store interacting with customers, a payment gateway, and a shipping provider.
When to use: Use a context diagram when you need a high-level overview of a system for communication or planning purposes.
Data flow diagrams or DFDs
Detailed view: DFDs provide a more detailed view of a system, showing its internal components, data flows, and processes. They can be further narrowed down into lower levels, with each level providing more detail than the previous one.
Example: If we continue with the example of an online store, a level 1 DFD might show the internal processes involved in processing an order, such as validating customer information, calculating shipping costs, and generating an invoice.
When to use: Use a data flow diagram when you need to understand the internal workings of a system for design or implementation purposes. This type of diagram is often more suitable for big data visualization requirements.
Now that it’s clear how context diagrams differ from DFDs, let’s look into their pros and cons.
Benefits of context diagrams
Here’s how context diagrams can help improve your workflows:
1. Provides an easily understandable overview
Context diagrams use simple shapes and lines to represent systems, external entities, and their interactions. This simplicity makes it easy for both technical and non-technical stakeholders to understand the big picture without getting bogged down in details.
2. Spotting potential issues early at a glance
Context diagrams can help identify potential problems with external factors early in development. This allows for proactive solutions and avoids costly fixes later. For example, a context diagram for a new software application might reveal a dependency on an external service that could pose a risk if that service becomes unavailable.
3. Creates a common language for diverse teams
As a common reference point for all stakeholders, context diagrams help foster collaboration and shared understanding by bridging the gap between technical and non-technical team members. They facilitate discussions about the system’s purpose, scope, and interactions with its environment.
As an example, a context diagram for a supply chain management system can be used by business analysts, developers, and logistics managers to align their understanding of the system’s role and dependencies.
4. Draw clear boundaries to prevent scope creep
In a context diagram, the system is represented by a single shape (often a circle or rectangle). Everything within that shape is considered part of the system, while everything outside is external to it.
This separation creates clear boundaries, much like a fence around a property. Clear boundaries establish the project’s scope – what’s included and what’s not. This helps prevent scope creep (uncontrolled expansion of the project) and keeps everyone focused on the core goals.
How about its downsides?
A context diagram has its cons too.
1. Potential for inaccuracy
While helpful to quickly understand systems, the high-level nature of context diagrams mean they can lead to oversimplification. If not thoughtfully created or maintained, the diagrams can become outdated or inaccurate as the system evolves. This could lead to confusion and misalignment among stakeholders, particularly if the diagram is used as a reference for decision-making or planning.
2. Lack of depth and detail
Context diagrams intentionally sacrifice detail for clarity, which can be a limitation in certain scenarios. While this high-level view is valuable for initial planning and stakeholder communication, it falls short when in-depth analysis or technical implementation is required.
For instance, a context diagram might not be sufficient for technical teams that need more detailed information for design, development, or testing. For these scenarios, use other types of diagrams like data flow diagrams or system architecture diagrams.
3. Potentially time-consuming
Creating an accurate and comprehensive context diagram requires a significant initial investment of time and resources, particularly for complex systems or those with numerous stakeholders. However, an upside to this “downside” is the time invested upfront can save significant time and effort later in the project.
When to use context diagrams
If you’re working on the early stages of a project, a context diagram would be helpful, particularly during:
Planning and scoping
Requirements gathering
System design
Communication and documentation
Context diagrams are also versatile tools ideal for the following processes:
Software development
Whether you’re developing a new app or enhancing existing software, a context diagram is a must-have tool. Use it to visualize how your software will interact with users, other systems, and external data sources to ensure smooth integration into the existing landscape.
Mapping out how a mobile app integrates with social media platforms for login and sharing is a good example.
Business process improvement
Visualize complex workflows and information design flow between departments, systems, or external partners. For instance, you can identify bottlenecks in a customer service process involving call centers, CRM systems, and knowledge bases.
Project management
One of the best ways to ensure everyone meets deadlines and is on board with the project scope is with a diagram that you can understand at a glance. A context diagram serves this purpose to a T – you can define project scope, identify stakeholders, and manage expectations with a clear overview of external dependencies. For example, use context diagrams to map out the interactions between a website development project, designers, developers, content creators, and hosting providers.
Onboarding
During the first few weeks, everyone suffers from information fatigue. Having a go-to visual that brings the whole organization structure and systems together in one place can be hugely helpful in orienting new hires for smooth onboarding.
As an example, you can illustrate how a new marketing hire’s role fits into the company’s broader marketing ecosystem, and share how marketing interacts with other departments, as well as grasp which tools they use for different platforms.
Stakeholder communication
For non-technical stakeholders, you need to bridge the gap between technical and business perspectives. A context diagram can showcase the impact of new systems on existing business processes, while simplifying the overall systems when you’re sharing a successful presentation. For example, you might need to show how a new inventory management system will integrate with existing accounting and sales platforms.
How to make a context diagram in 4 easy steps
Now, you’re ready to experiment with context diagrams. To make the process easier, you can either use a diagram template (from Piktochart’s template library) or follow the steps below.
Step 1: Decide on the scope of your system.
Before starting with your context diagram creation, determine what’s in and out in your system. Identify the boundaries of the system you’re analyzing.
Identify the core system by defining the specific software, processes, or components you’re focusing on.
Outside the system, identify external elements that interact with your system, but aren’t part of it. These could be users, other software systems, databases, hardware devices, etc.
In your context diagram, represent the entire system as one single box or shape. This simplifies and provides a high-level overview for now.
Let’s have an online banking system as an example. The “inside the system” is the banking software itself, while external entities are the customers, their web browsers, the bank’s database, and maybe external payment processors.
Step 2: Identify and add external entities.
Next, brainstorm and list all the external entities that interact with the system. These could be users, other systems, organizations, or any other element outside the system’s boundary.
Once you’re done, place these external entities around the central system shape. Each entity gets its own symbol (usually a rectangle or oval), with a clear label describing what it is.
For the online banking system example above, external entities might be labeled as “customer,” “web browser,” “central database,” and “payment gateway.”
Step 3: Map out data flows to establish relationships.
Draw lines (usually arrows) between the system and each external entity to represent the relationships or interactions between them.
These arrows are the “verbs” of the diagram, showing the actions happening between your system and the entities.
Direction: The arrowhead points to where the data is GOING.
Content: Label the arrow to briefly describe WHAT data is being sent/received.
Label each arrow to show the kind of information passed between the system and the outside elements. This step clarifies how data moves within your context diagram and illustrates the flow of information in the process.
For example, an arrow from “Customer” to “Online Banking System” might be labeled “Login Credentials,” while an arrow in the reverse direction could be labeled “Account Balance.”
Step 4: Review and refine
It’s time to finalize and review your context diagram to ensure it accurately captures the system’s context, boundaries, and interactions. If possible, show your diagram to people who are knowledgeable about the system. They can spot missing elements and incorrect relationships or offer better label wording.
Finally, context diagrams aren’t set in stone. As your system evolves, so will its interactions. Be ready to update the diagram to reflect changes.
Best practices for creating context diagrams
Before you start tinkering with your context diagrams, take note of these best practices to help you do it right the first time.
1. Know your system inside and out
A context diagram is just a high-level overview. Don’t stress over the nitty-gritty details. Start with the main thing you’re mapping out (the system) and the key players outside it.
2. Keep it simple
Stick to basic shapes (rectangles for your system, circles for external entities) and arrows to show the flow of information. Less is more here!
3. Label everything clearly
Give your system a descriptive name, and do the same for each external element. Context diagram labels should be brief but informative.
4. Tailor the level of detail to the intended audience
A diagram for technical experts might include more specifics than one for non-technical stakeholders.
5. Use the tool that works best for you
You can start with a pen and paper or a simple diagram maker like Piktochart. Choose what works best for you.
6. Document any assumptions or constraints
Note any assumptions you’ve made (e.g., about the system’s environment) or any constraints limiting how the system can operate. This also helps others understand your thinking.
Context diagram examples
Now that we’ve covered the steps and process of creating context diagrams, let’s explore context diagrams in action.
Student information system context diagram
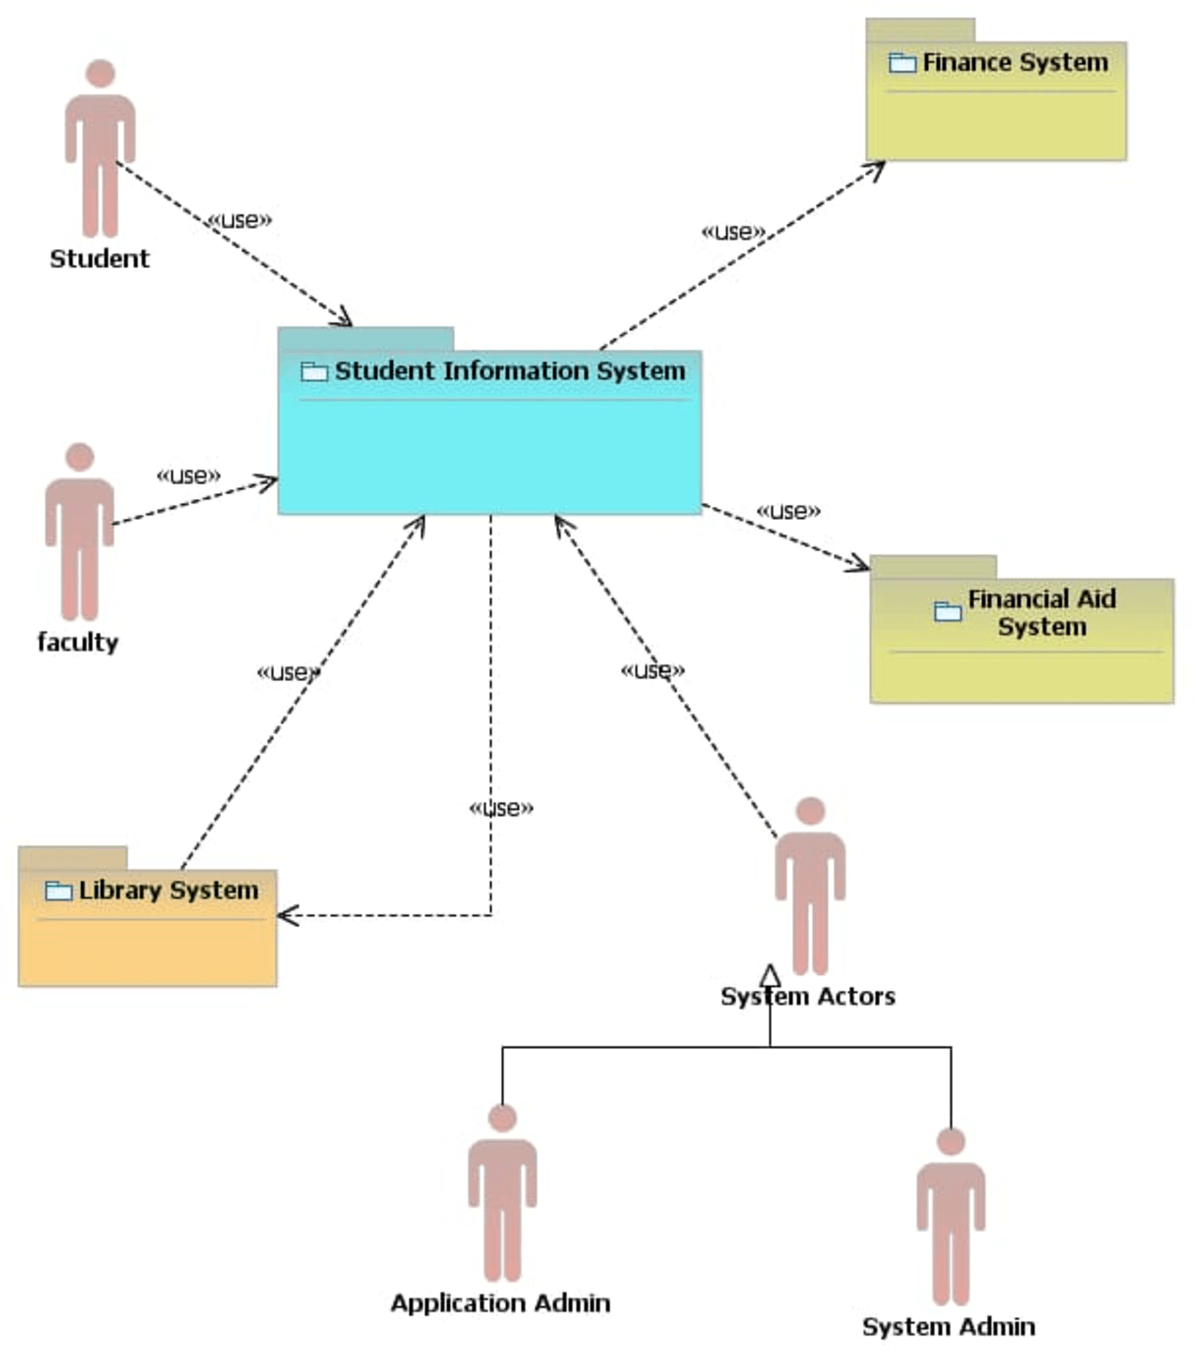
The Student Information System (SIS) is the central hub for all student-related data and processes within an academic institution. Students and faculty use it for essential tasks such as course enrollment, grade management, and progress tracking.
The SIS seamlessly integrates with other external systems:
The finance system handles tuition payments.
The financial aid system determines student eligibility and disburses funds.
The library system may exchange data for resource management.
You’ll also see in the context diagram that dedicated administrators help ensure the smooth operation and security of the SIS software and its underlying infrastructure.
Travel agency system context diagram
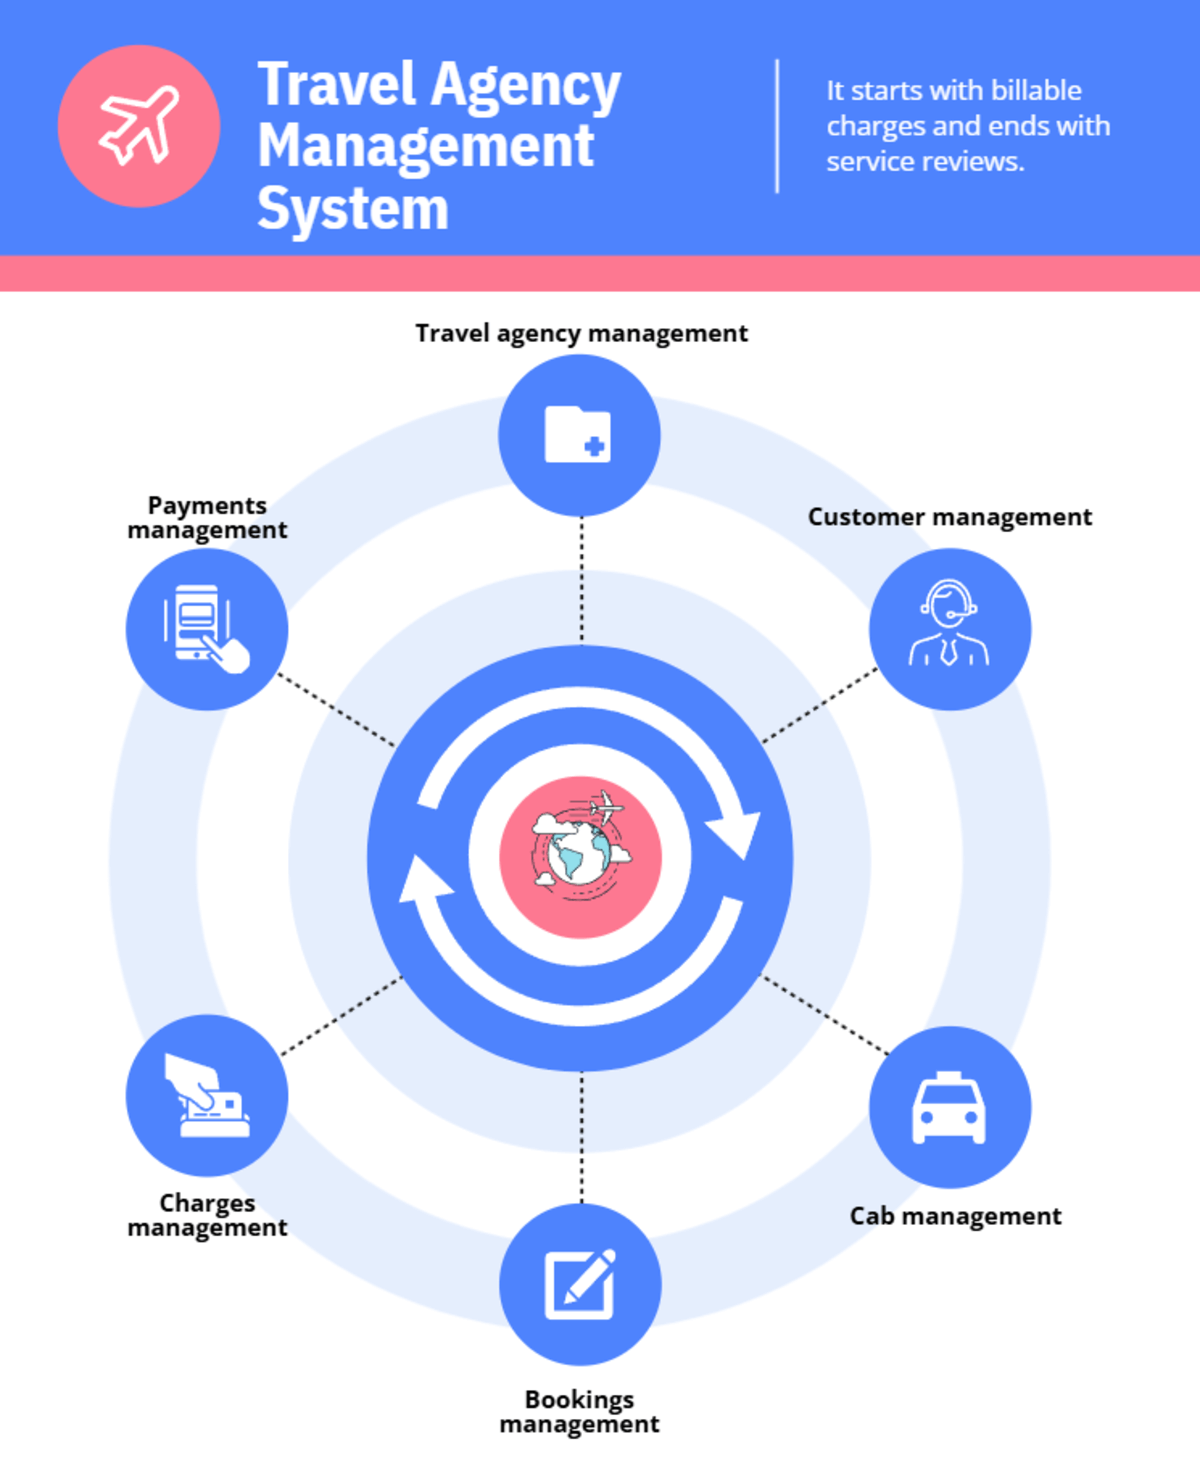
This context diagram provides a high-level overview of a travel agency’s operations and its interactions with external systems. The Travel Agency Management System (TAMS) is the hub for all operations within a travel agency. It interacts with various external entities, including customer management, payments management, charges management, cabs management, and bookings management.
These entities exchange data with the TAMS to facilitate bookings, payments, transportation arrangements, and overall customer management. This simplified overview provides a clear picture of how the system interacts with its environment.
Clothes ordering system context diagram
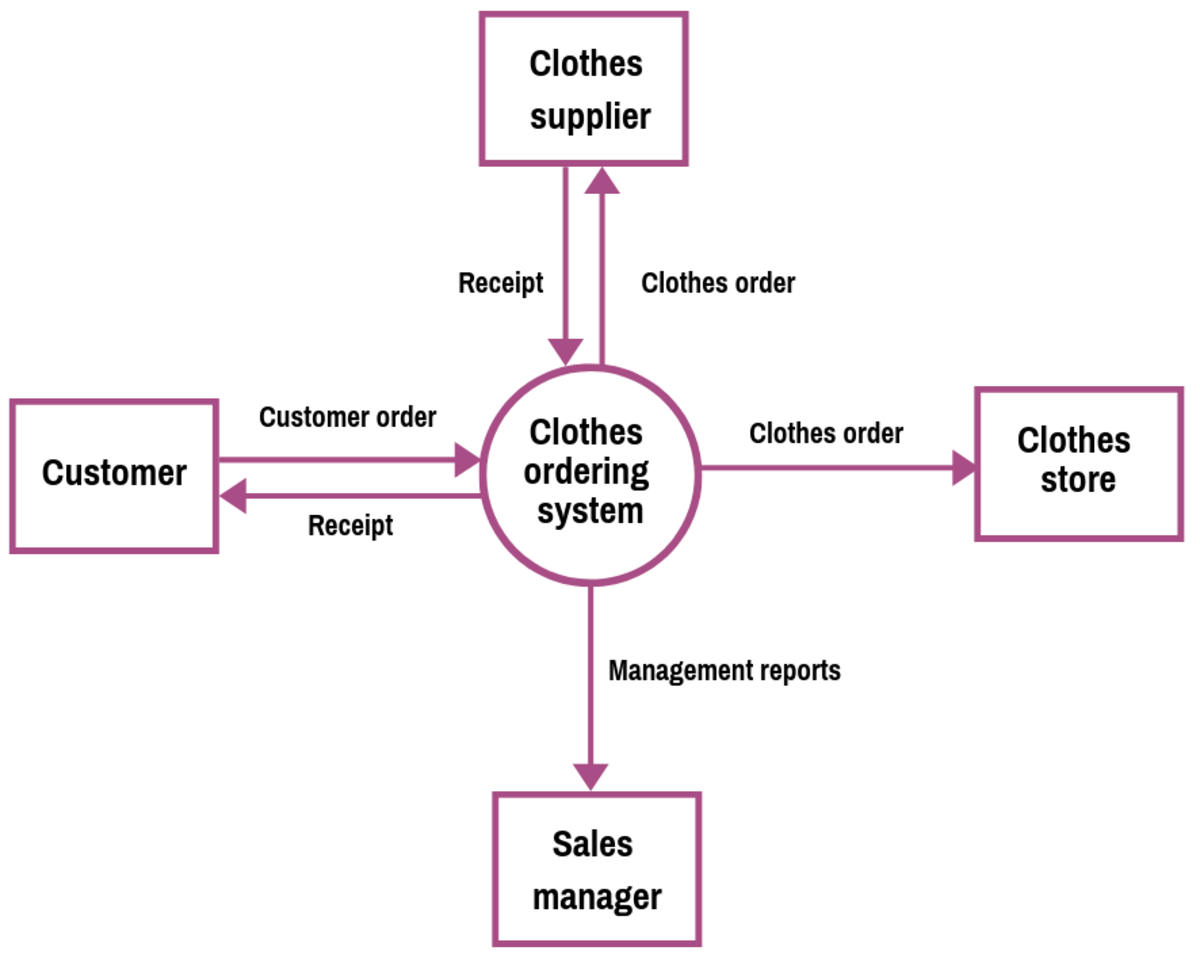
The Clothes Ordering System acts as the central system and drives the entire process of ordering clothes from suppliers to customers and stores.
Customers place their orders through the system which initiates a chain reaction that involves the supplier fulfilling the order and the store ultimately receiving the clothes for sale. The system also generates management reports for the sales manager and provides valuable insights into sales trends and performance.
This bird’s-eye view is helpful for understanding the system’s scope and its role in coordinating the entire clothes ordering process.
Build context diagrams fast with Piktochart’s online diagram maker
A context diagram is a simplified overview of a system’s interactions with its external environment. While they may lack depth and require thorough preparation, their ability to provide a clear, concise overview of a system’s context makes them indispensable tools for effective project communication and planning.
With Piktochart, you can easily make a custom context diagram, chart, graph, and more.
Sign up for a free plan if you haven’t yet!