Flow charts are a powerful visual way to outline your business processes, decision-making criteria, and track progress.
Streamlining complex operations and improving decision making is achievable by outlining processes step-by-step. A visual representation of the entire operation can be provided, which makes it easier to identify bottlenecks, redundancies, and areas for improvement.
In this article, we will provide you with 21 free flow chart templates for different use cases across various software platforms. So, no matter your preference, there will be a flow chart here for you!
If you are looking for beautiful, in-built designs, you can start editing now; sign up to Piktochart for free and get access to a full suite of flow chart templates.
What is a flow chart?
A flow chart is a diagram that visually maps out and simplifies complex processes. Through the use of repeated symbols and arrows, readers can follow the sequence of steps, decisions, or actions required to complete a task or reach an objective.
Flow charts are typically used to show processes, but they can also be helpful for several other documents that outline steps to be followed. For example, you could use them to pinpoint bottlenecks, make or justify decisions, organize teams or tasks, or track progress.
Flow charts, much like maps, provide a clear path from the starting point to the destination. By utilizing visual elements, such as flow charts, viewers can understand and retain information more easily. This makes the information presented more digestible and comprehensible.
Process charts
Process flow charts offer a great way of documenting workflows, identifying bottlenecks, and standardizing procedures. By visualizing the steps involved in a process, team members can more easily understand each other’s roles and responsibilities, share ideas for improvement, and identify potential issues before they become major problems.
The design of process charts uses standardized symbols and a sequential layout, making it easy for people to follow the flow of activities and understand the steps involved in a process.
For example, project managers at engineering firms often use process charts to document the product development lifecycle. The logical flow of steps helps identify critical milestones, dependencies, and areas for optimization.
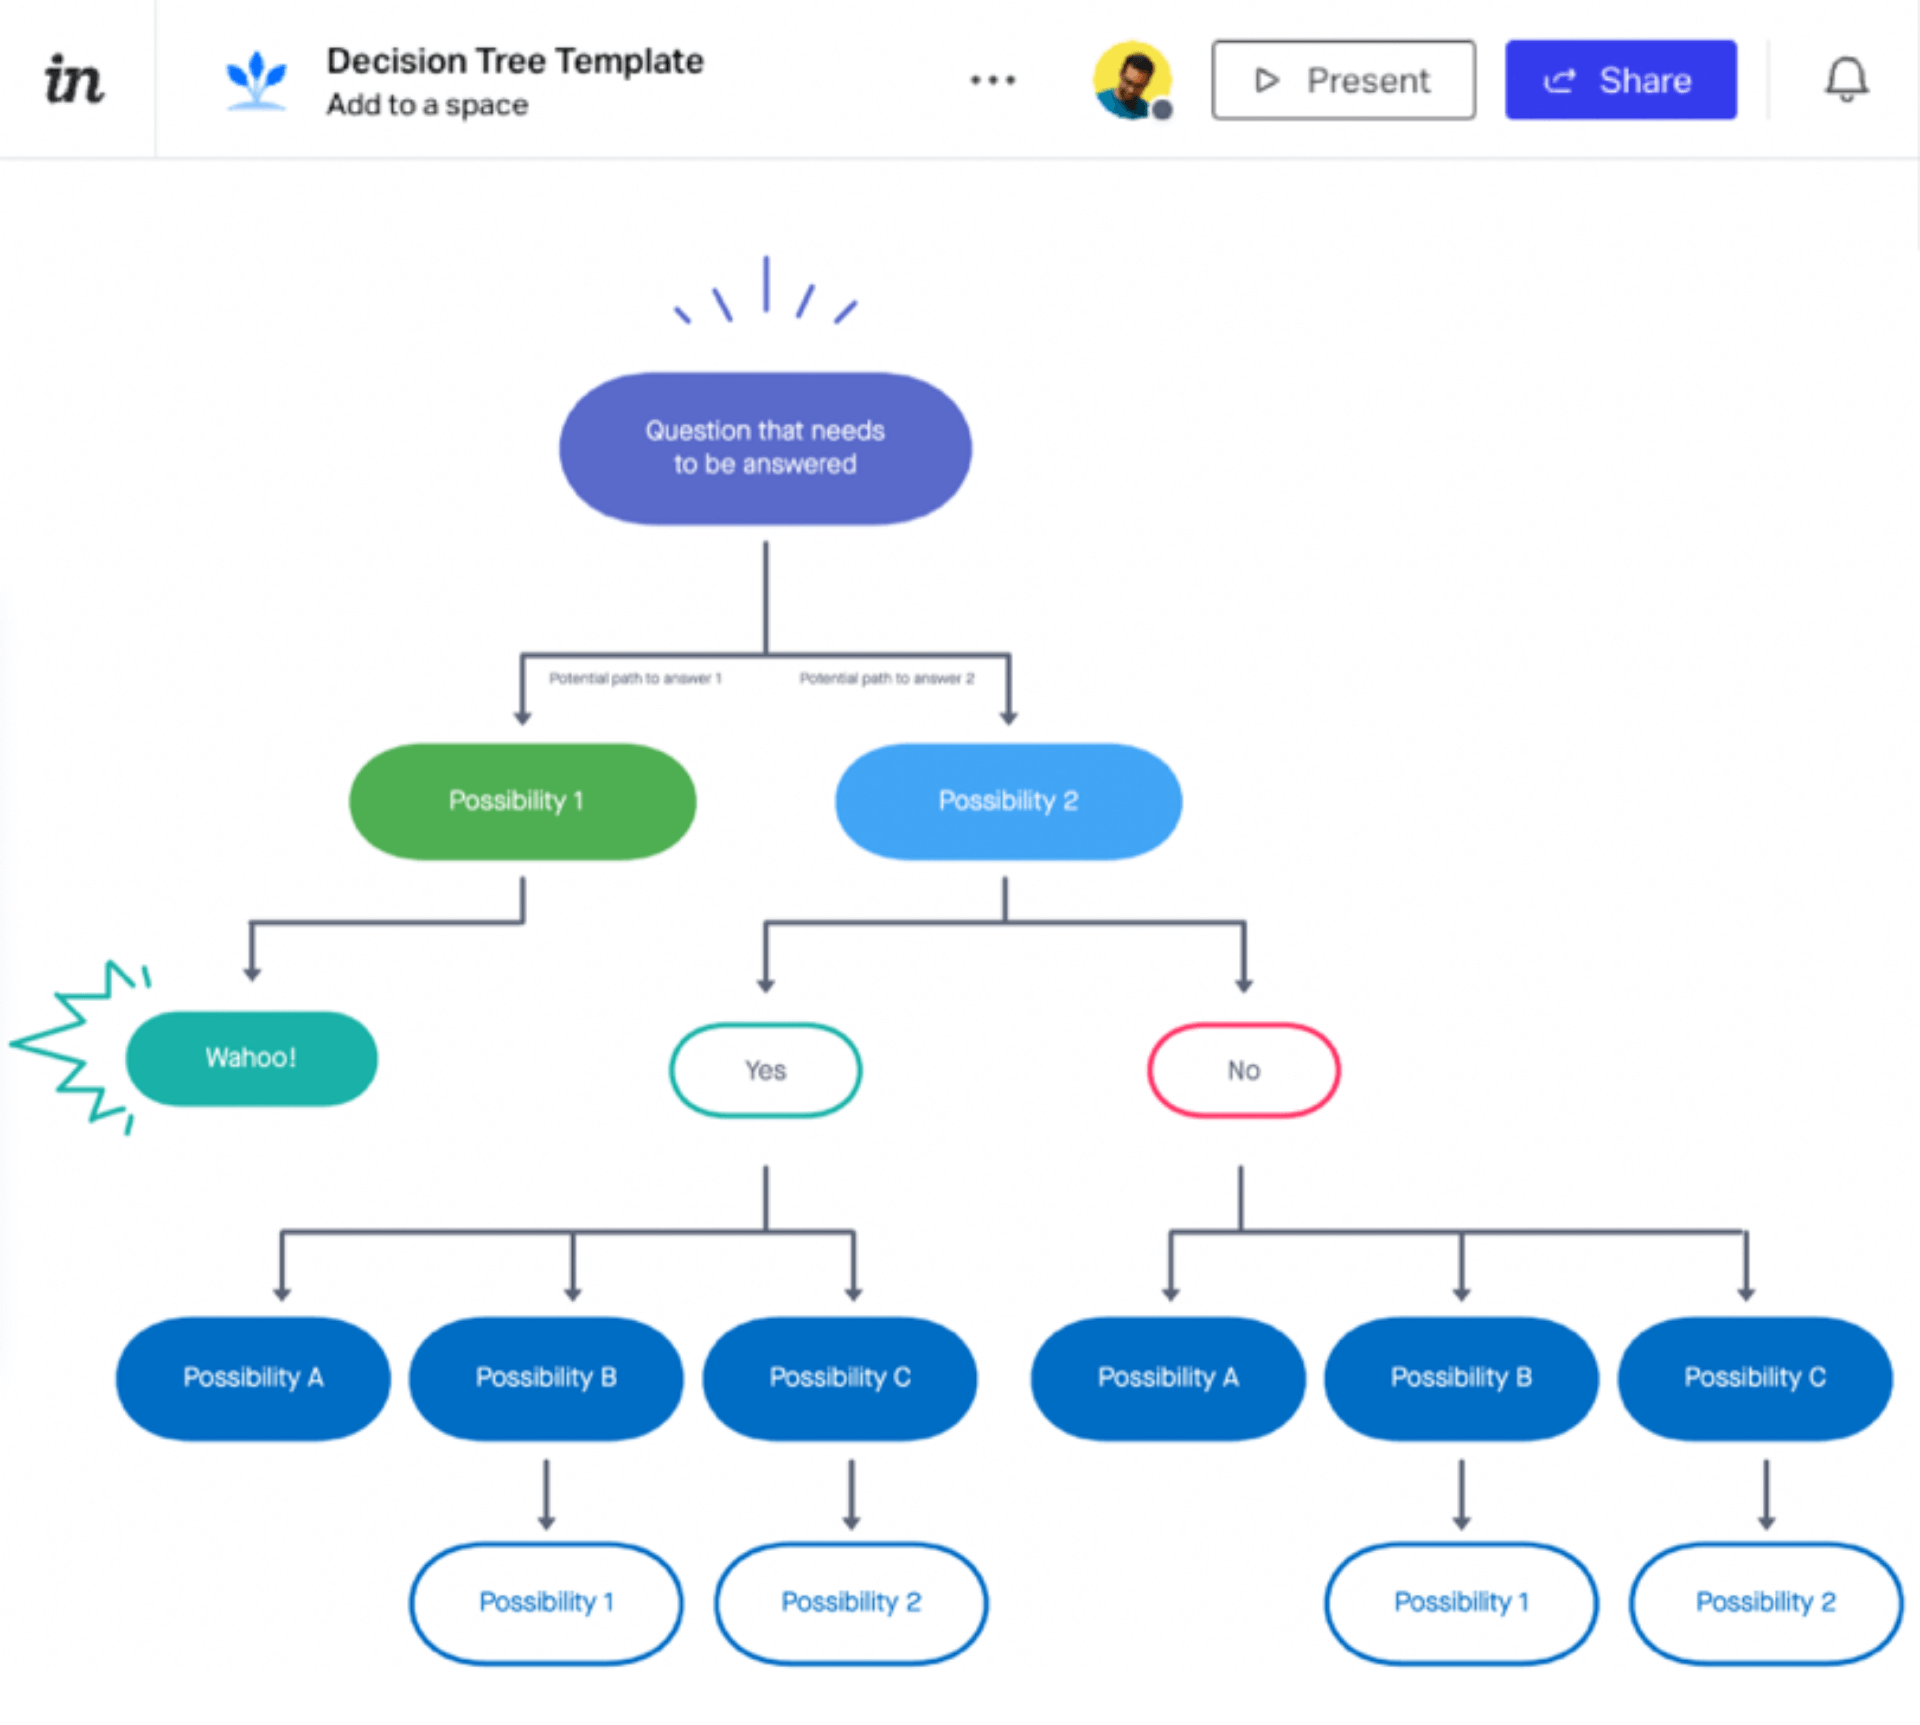
Decision trees
Decision trees are the ultimate tool for navigating complex choices. By mapping out each possible path as a series of ‘if this, then that’ branches, they help teams assess alternative ways forward, predict outcomes, and support data-driven analysis.
The great thing about the decision tree is that it breaks down judgments into simple steps. At each branch, you’re faced with a simple, binary choice. Follow the forks to their natural conclusion, and the best path becomes clear. It will also help you narrow down where your team faces roadblocks and what decisions must be made to move past them.
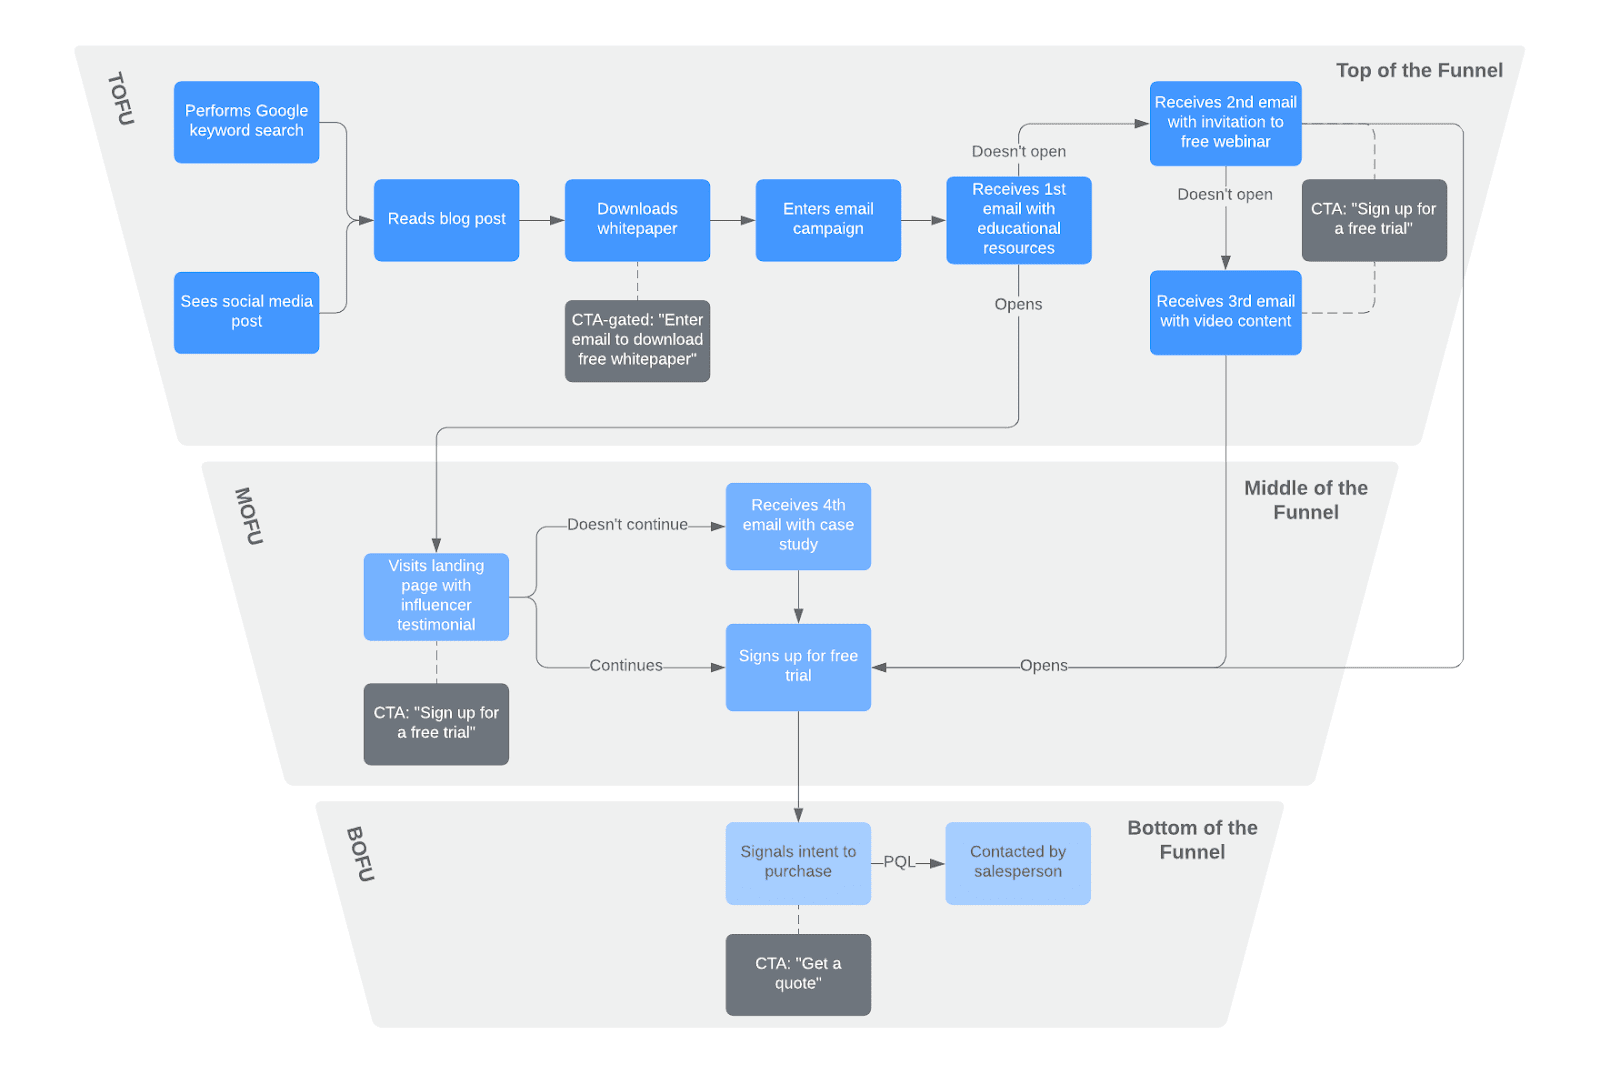
Marketing teams could use this flow chart to create a logical flow to track the buyer’s journey or analyze customer personas and determine the most effective social media channels to post product updates.
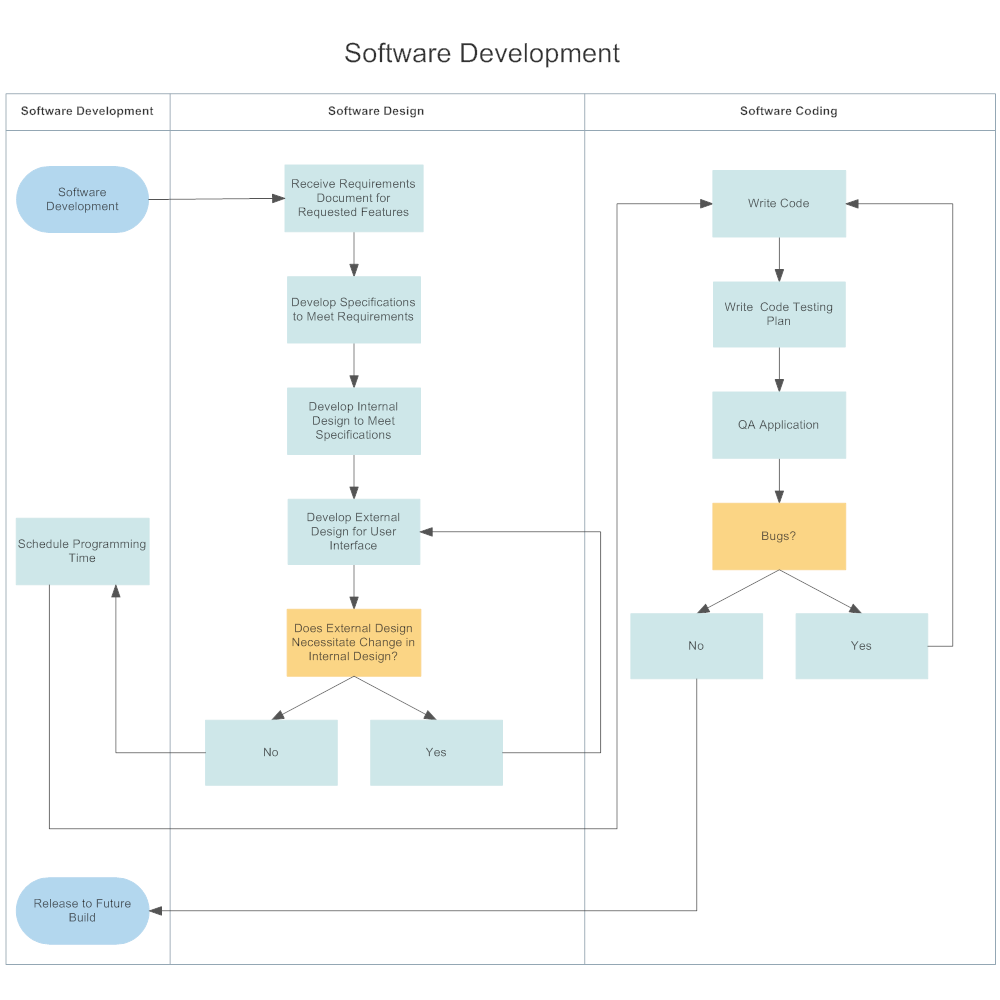
Swimlanes
Swimlane flow charts are a visual way of mapping cross-functional processes and defining roles and responsibilities. Having this clearly defined can lead to improved collaboration and accountability across teams.
For example, software development teams use swimlane flow charts to map the development process, clarify roles, and ensure smooth collaboration between developers, testers, and project managers.
In this example, three non-linear stages of development require teams to work collaboratively and pass the project back and forth. A swimlane flow chart works well to illustrate this.
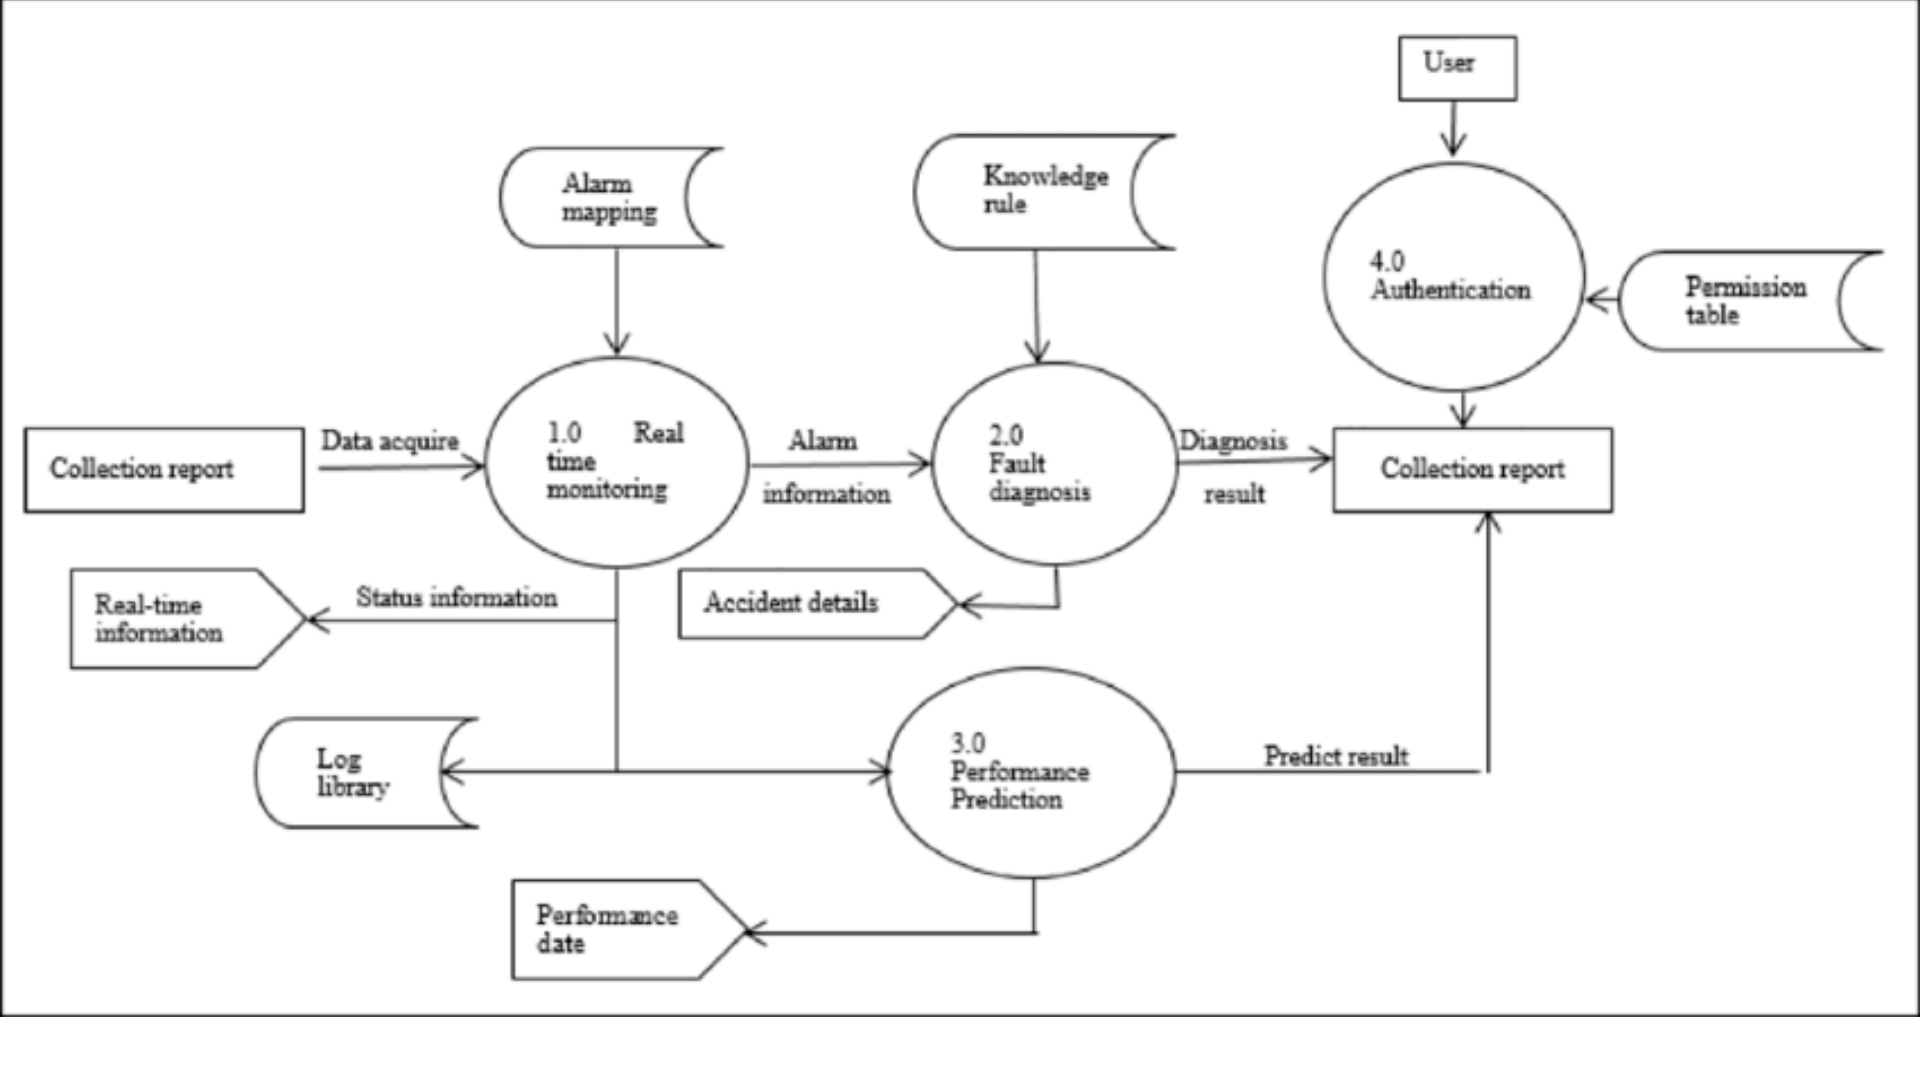
Data flow diagrams
Complex data processes can be challenging to communicate with the broader team. Using a data flow diagram, your team will have a clear way of digesting the data processes and understanding the sources and interactions of that data.
This flow chart is particularly useful for understanding data dependencies, which can be integral to the health of your data collection. If a dependency isn’t clear and another department makes changes, this could threaten the integrity of all your data insights.
Healthcare organizations often use data flow diagrams to explain the patient’s data flow within their electronic medical records system.
This high level of oversight is critical for ensuring regulatory compliance and identifying opportunities to streamline care.
Cause and effect diagrams
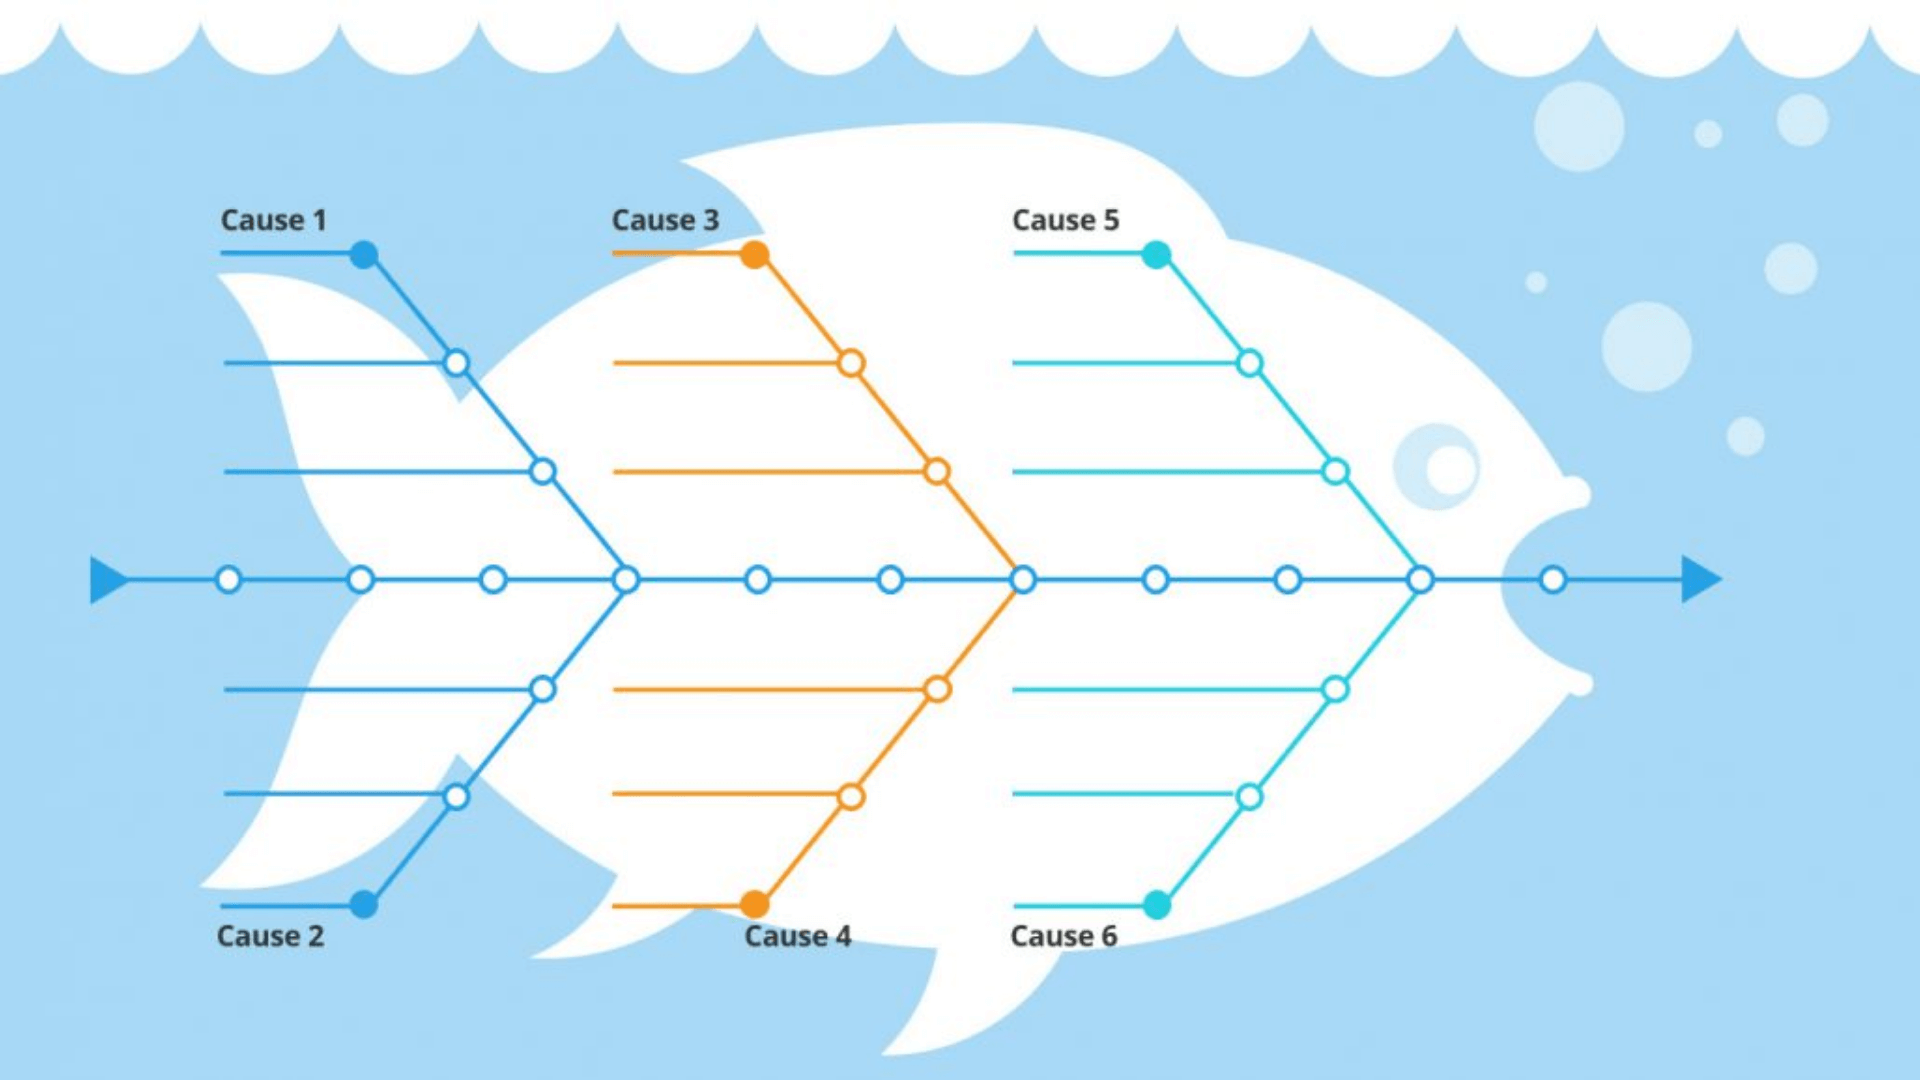
Also known as a “fishbone diagram,” cause and effect flow charts help you complete a root cause analysis, assist with problem-solving, and develop quality improvement initiatives.
Having a visual representation of cause-and-effect relationships can uncover hidden causes and be an excellent tool for facilitating collaboration across your team.
For example, automotive manufacturers dealing with an uptick in warranty claims could use cause and effect diagrams to investigate quality issues down to the source. Mapping out potential causes like parts defects, process errors, and design flaws would highlight the common denominator, pointing to an efficient fix.
Organizational charts
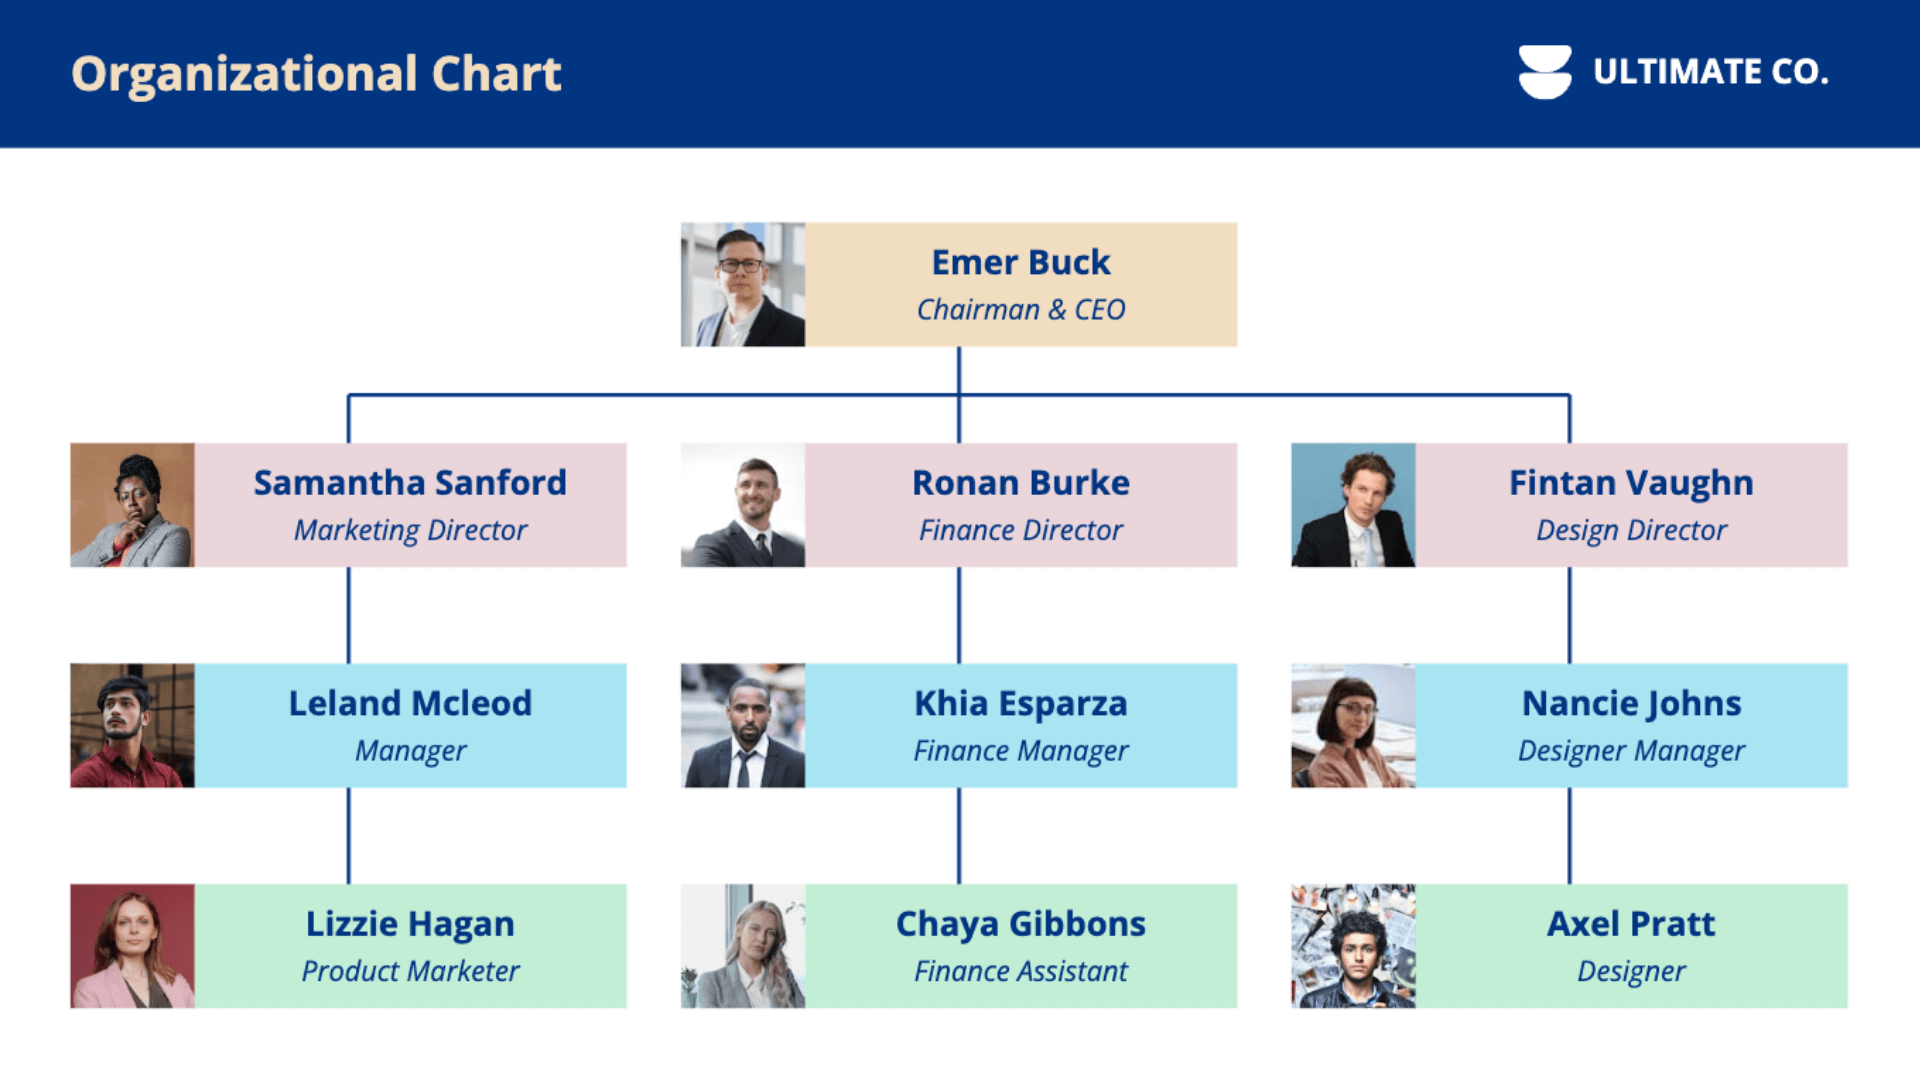
Org charts are key for businesses, showing the company’s structure, roles, and reporting lines. They help staff understand their roles, approvers, and career progressions. As the business grows, its importance increases.
Include staff’s contact info and time zones on org charts, especially for international companies. This aids communication across the organization and ensures everyone is on the same page.
Free Flow Chart Templates
Are you looking for a way to visualize complex processes and workflows? Creating a flow chart from scratch can be a daunting task, but don’t worry, we’ve got you covered!
There are a variety of free flow chart templates available online that can save you time and effort. These templates are perfect for anyone who wants to create a professional-looking flow chart quickly.
Flow chart templates for Word
Word is a popular software choice for businesses, which means you can use many great templates for flow charts! Here are eight of our favorites.
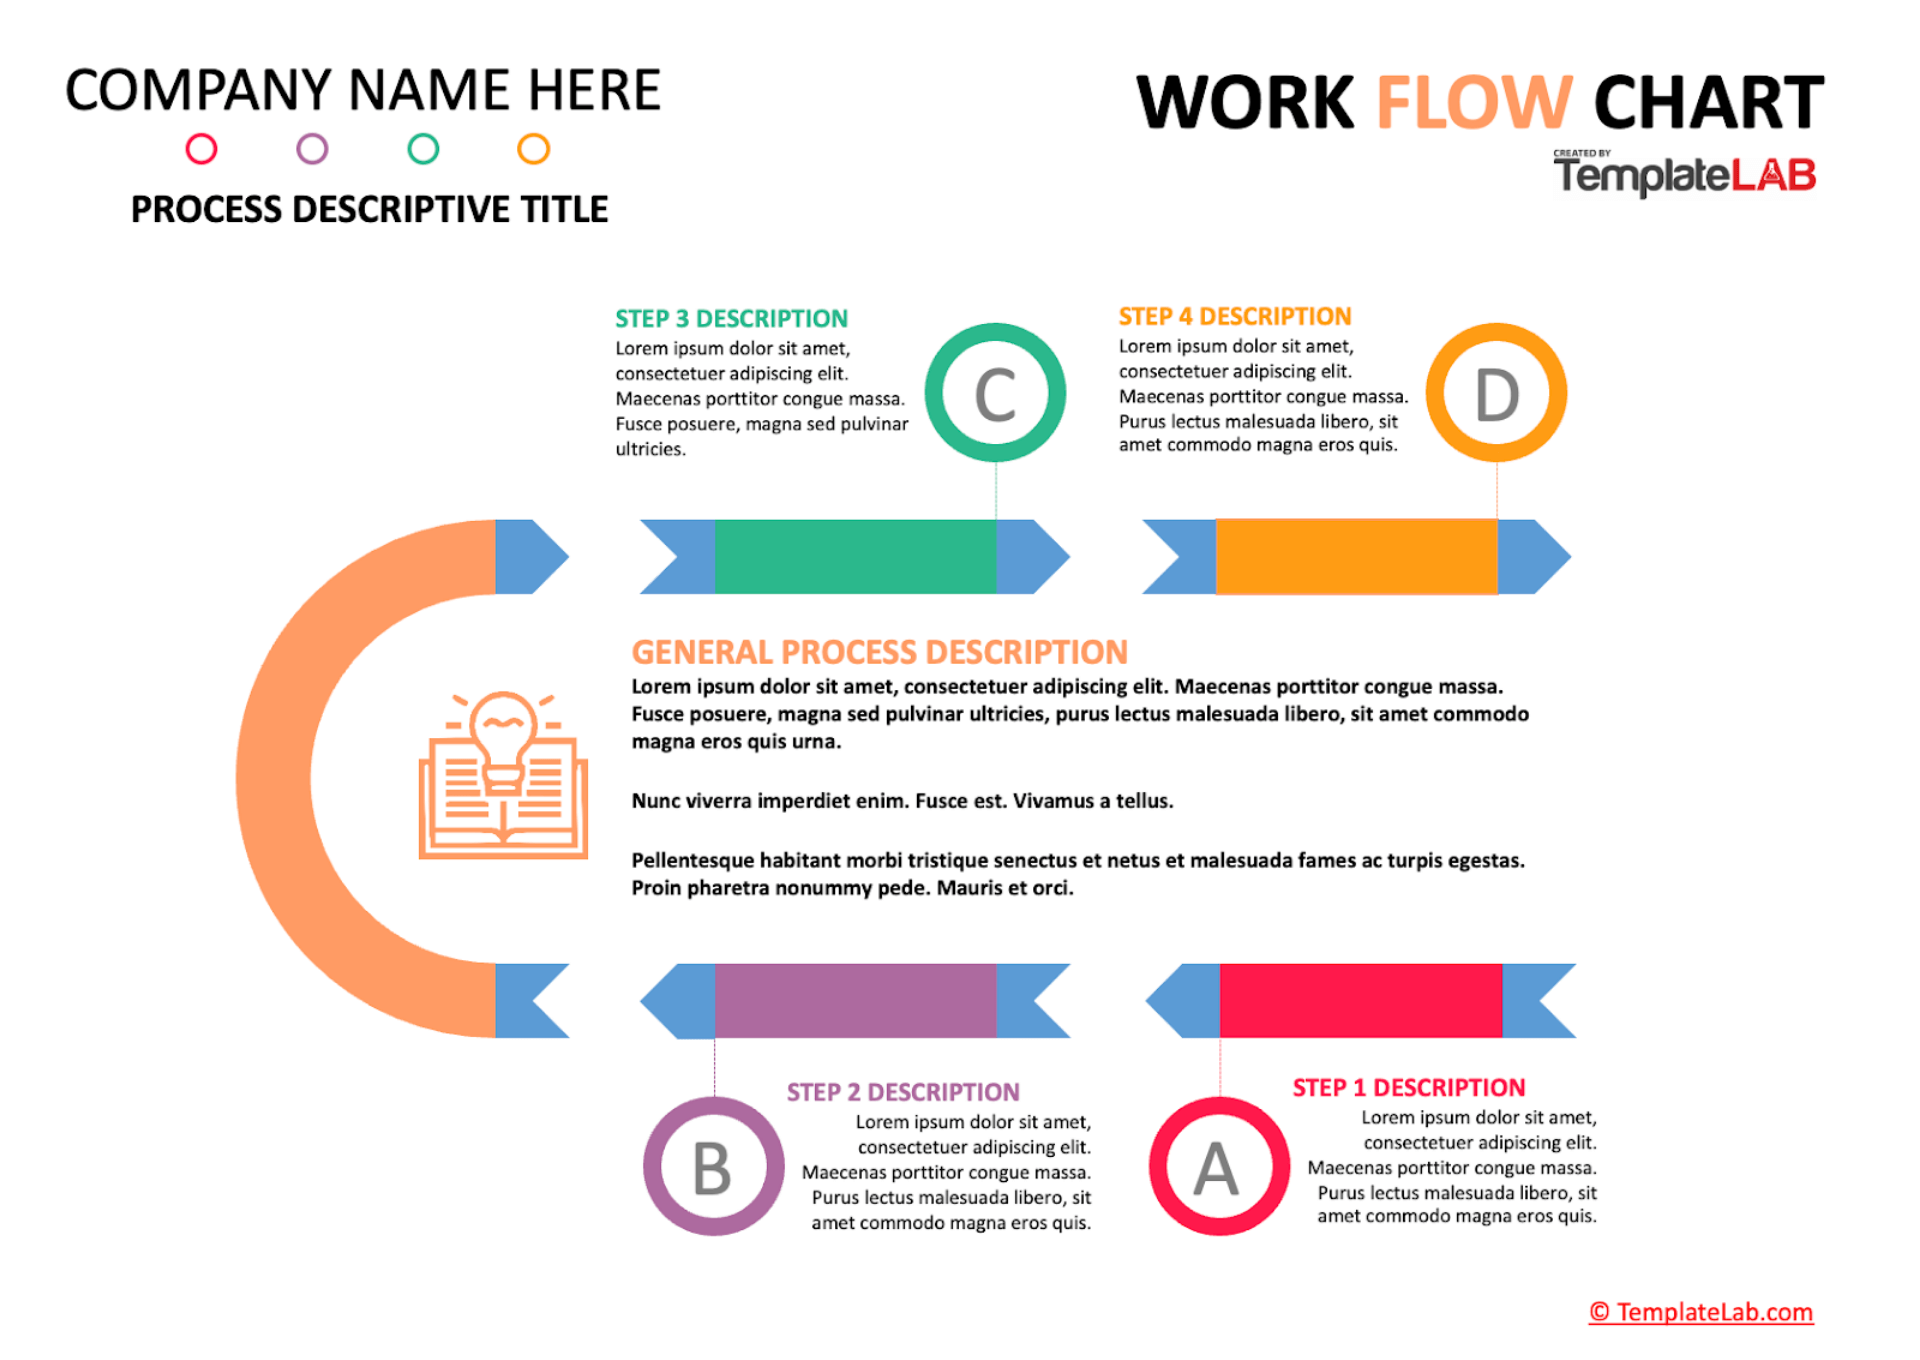
1. Work Flow Chart Template
This template is excellent for a simple everyday process, such as outlining the steps in a customer support ticket resolution workflow.
It includes sections you could use for task assignment, status updates, and completion, making it easy to track progress and ensure timely resolution of customer issues.
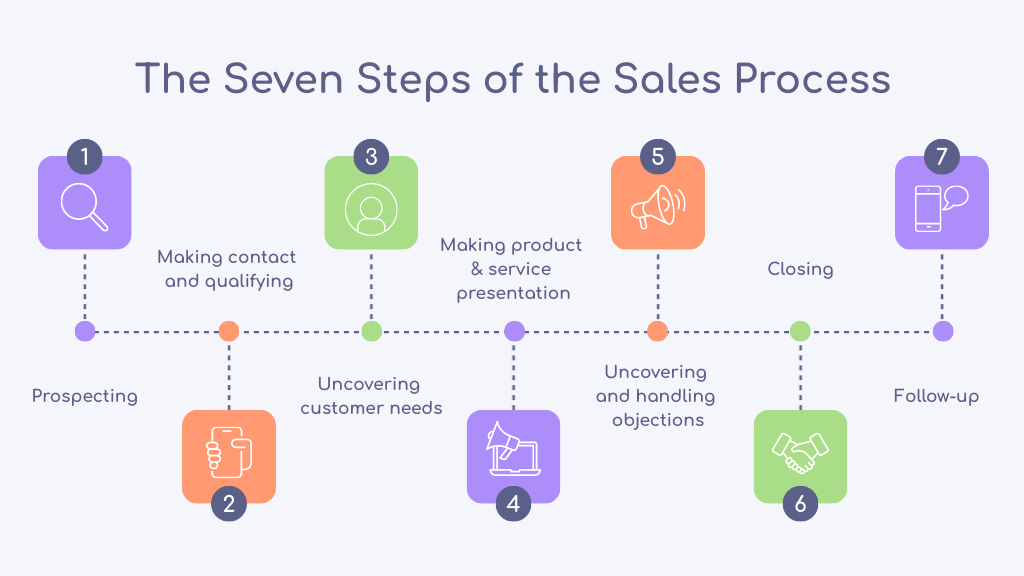
2. Simple Work Flow Chart
This streamlined seven-step template’s bright, bold color scheme and clean layout make it a breeze to spot potential roadblocks and keep your team on track.
It would be a great template to fill out with steps for customer care because of its bright colors and precise flow.
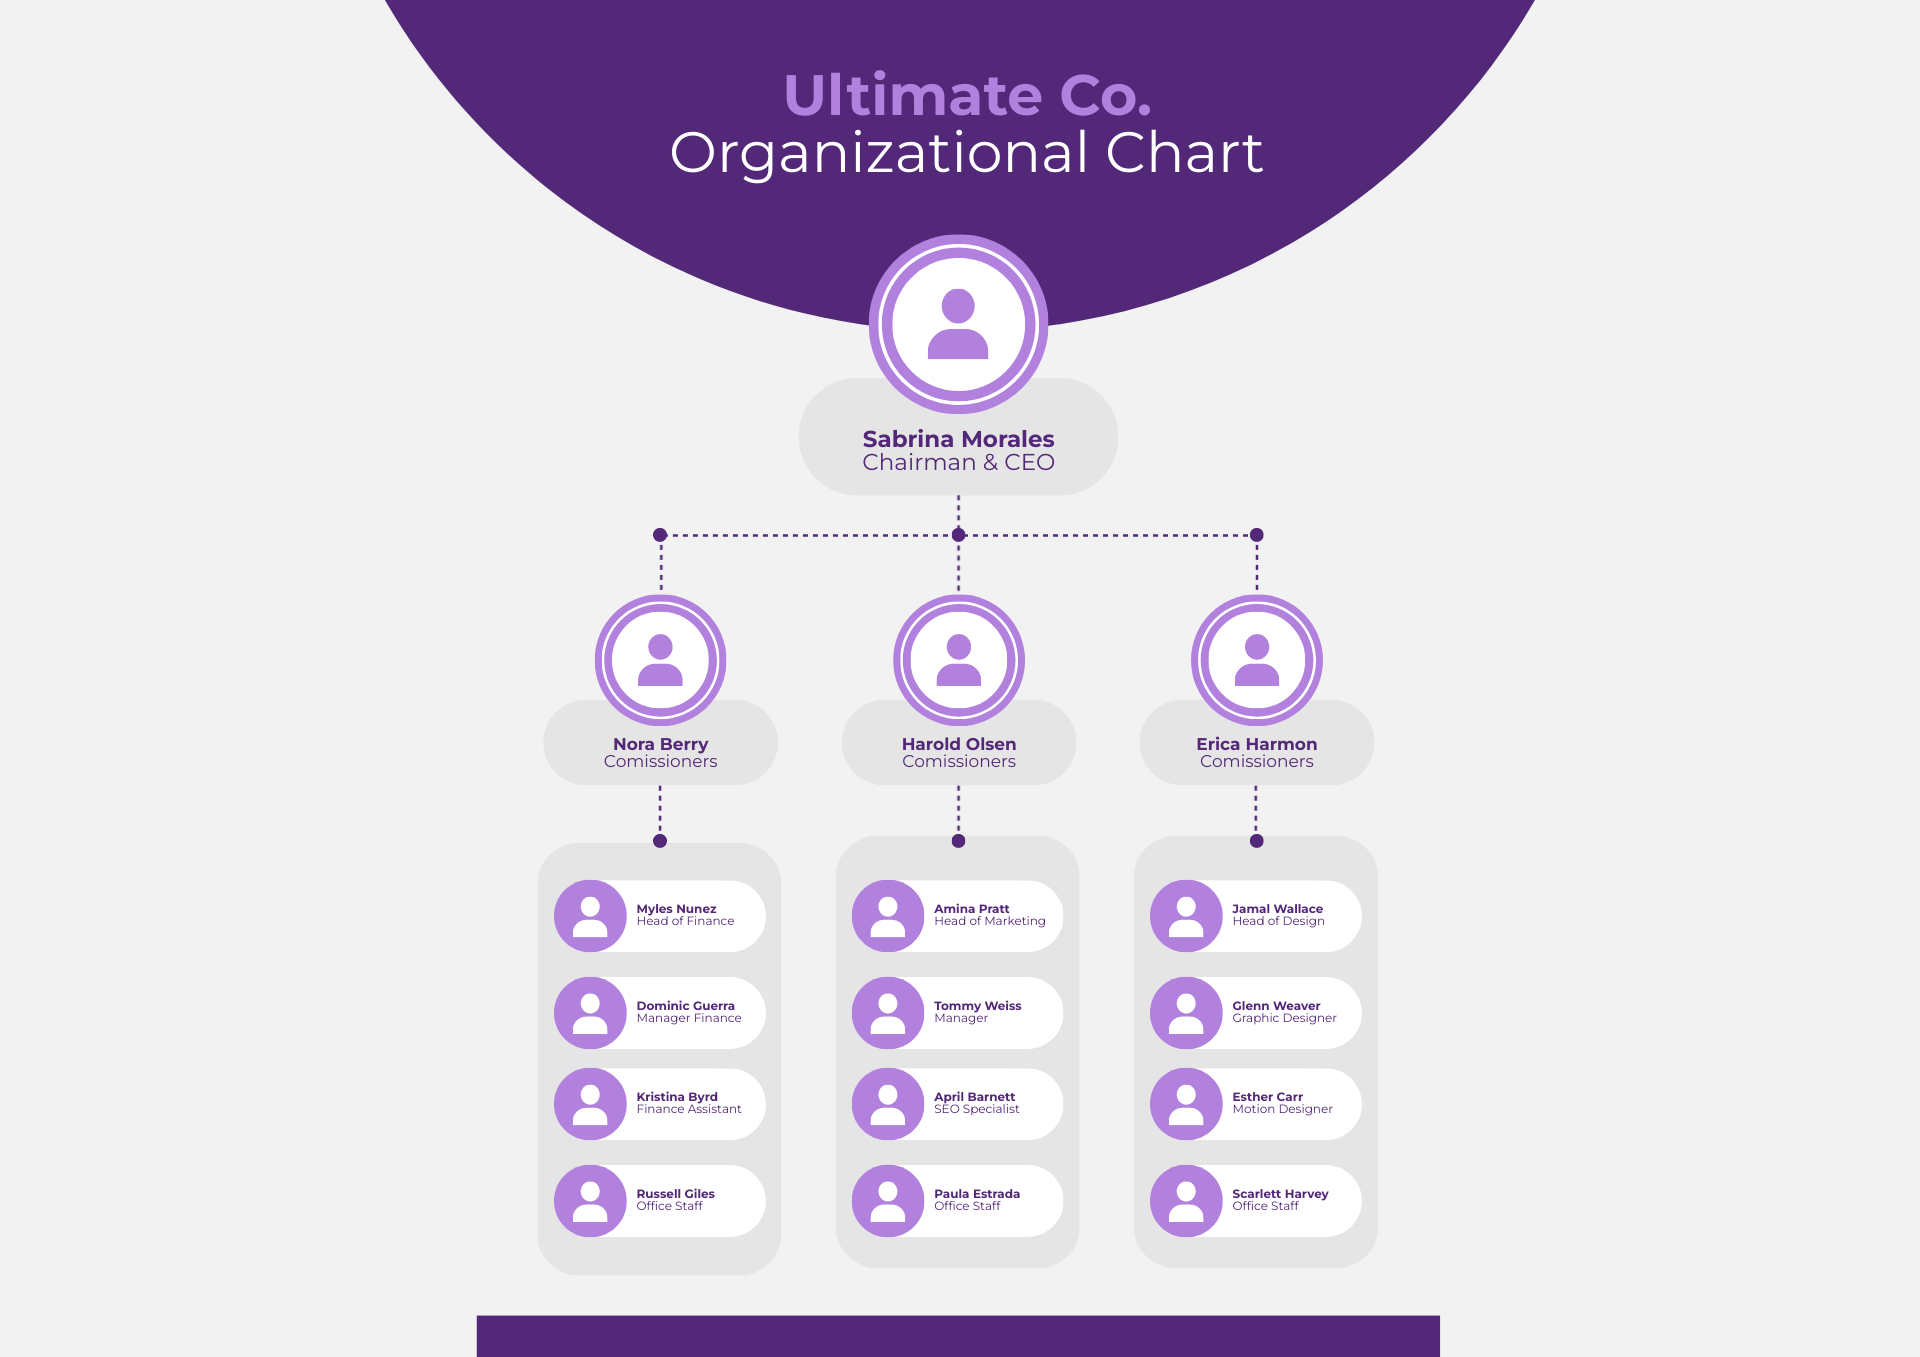
3. Corporate Organizational Chart
This template is a classic organizational chart to outline roles, reporting lines, and career progression within.
4. Swim Lane Process Map
This template helps teams see who’s doing what in a process by dividing tasks into lanes, making collaborating easier. No more wondering when things will be passed back and forth between teams; with this simple flow chart, it will be apparent from day 1.
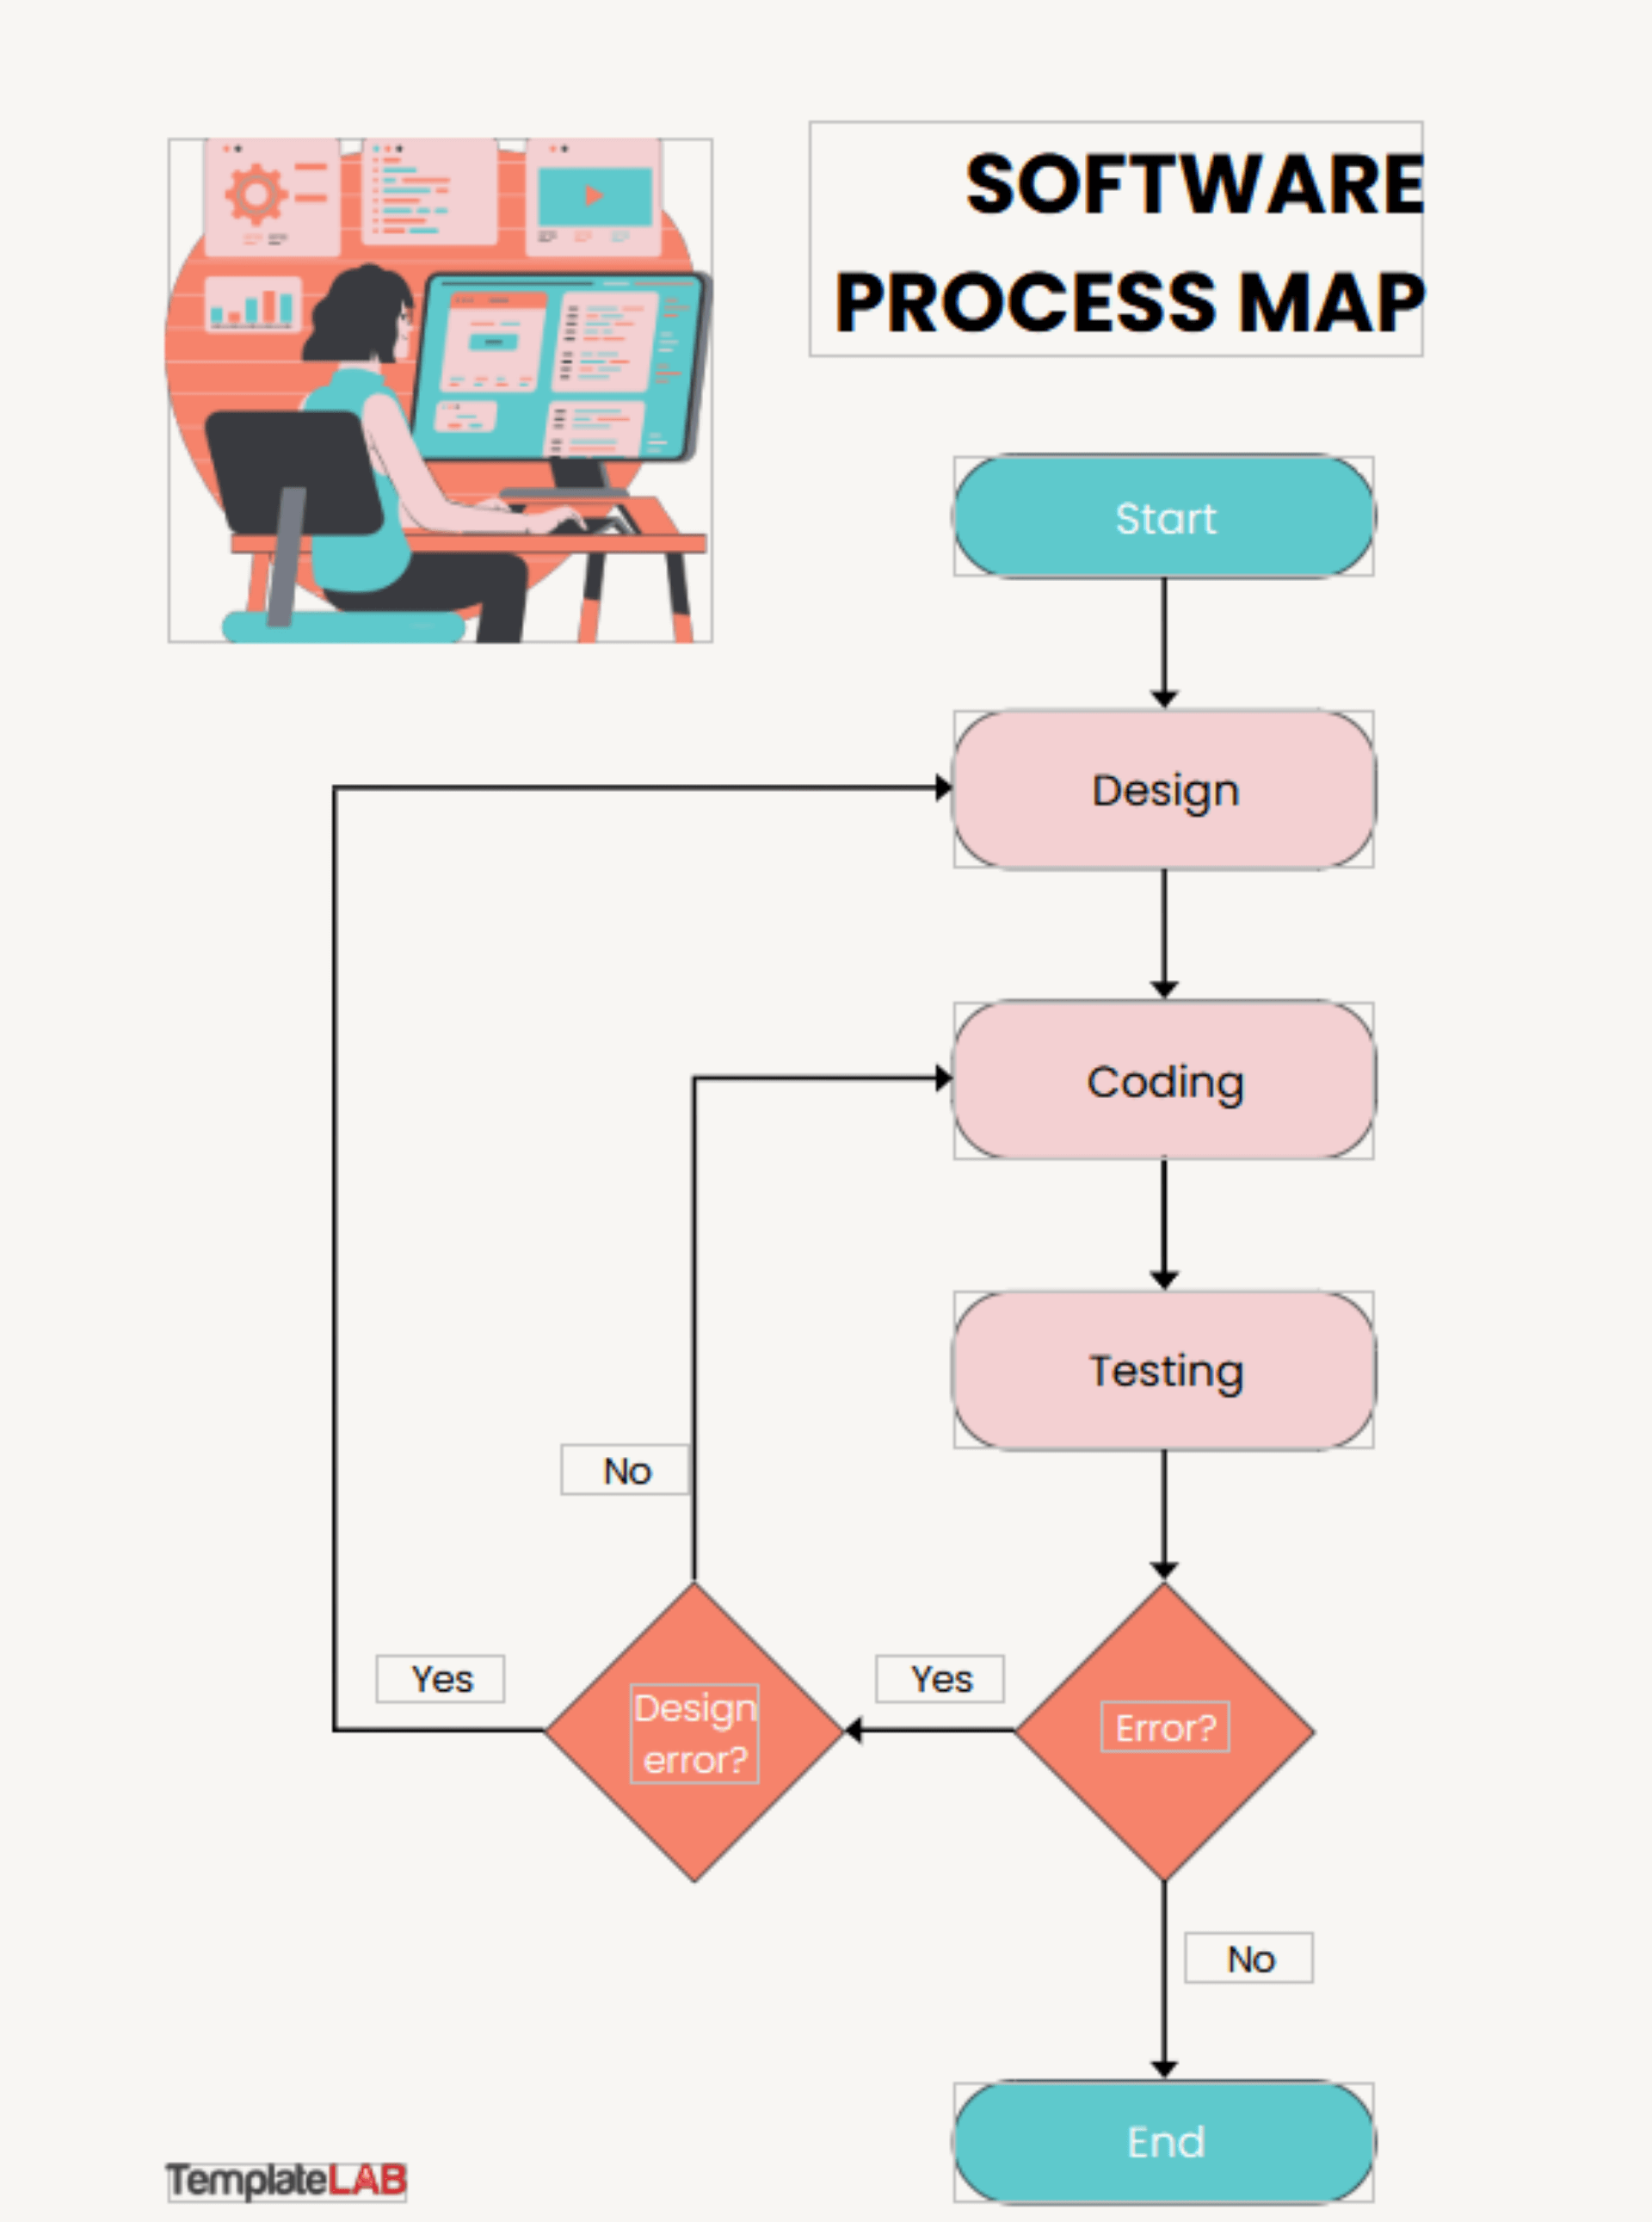
5. Software Process Map
This software process map template lays out the journey of creating software. It breaks down the tasks into different boxes, each with a role assigned to them.
It makes the order of your product development especially clear and even has a decision tree element at the bottom to help your team define if the project is finished.
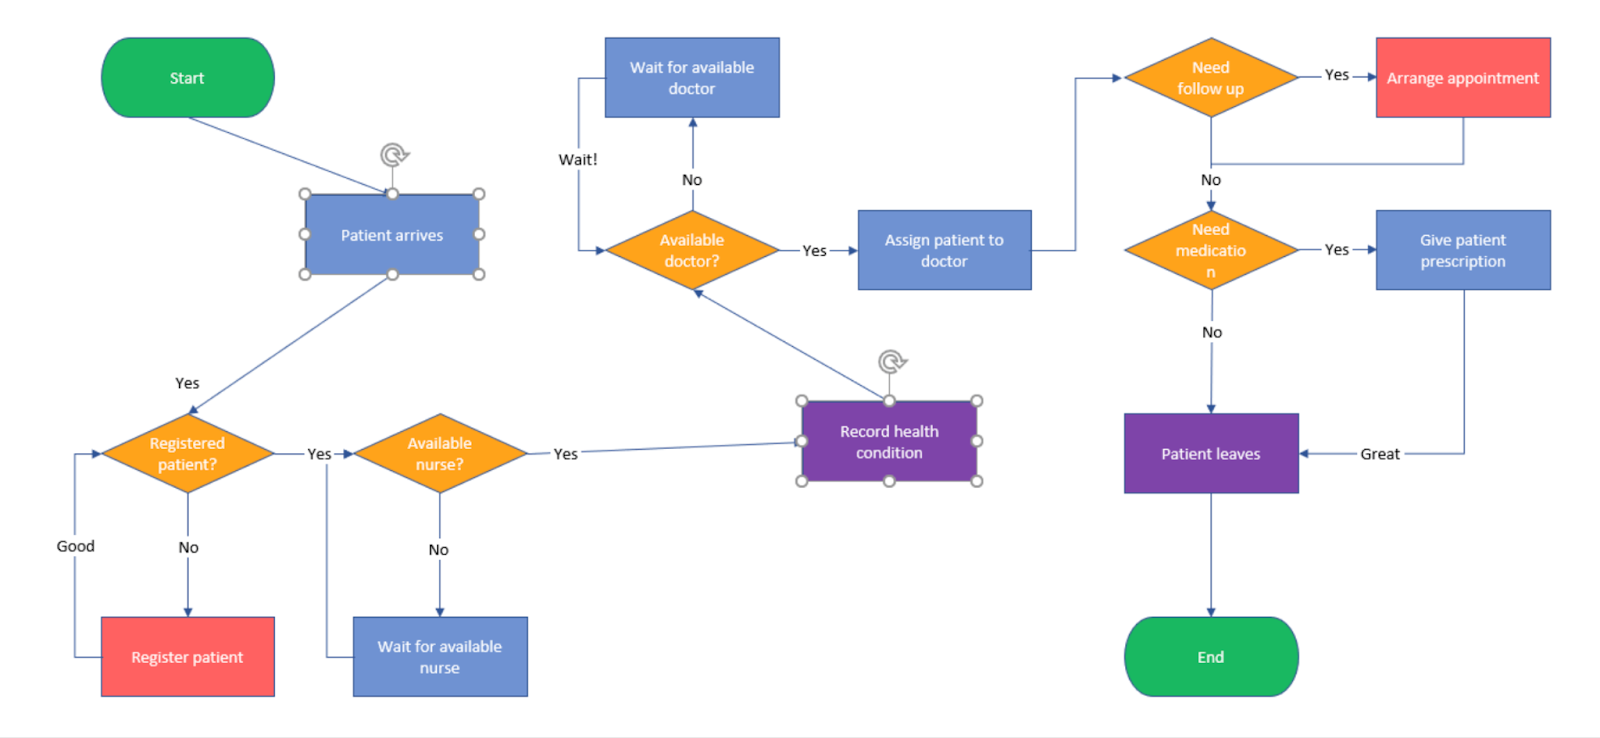
6. Patient Flow Chart
This template is helpful for medical professionals who want to map their patients’ journeys. It helps them ensure consistent and high-quality care for all patients.

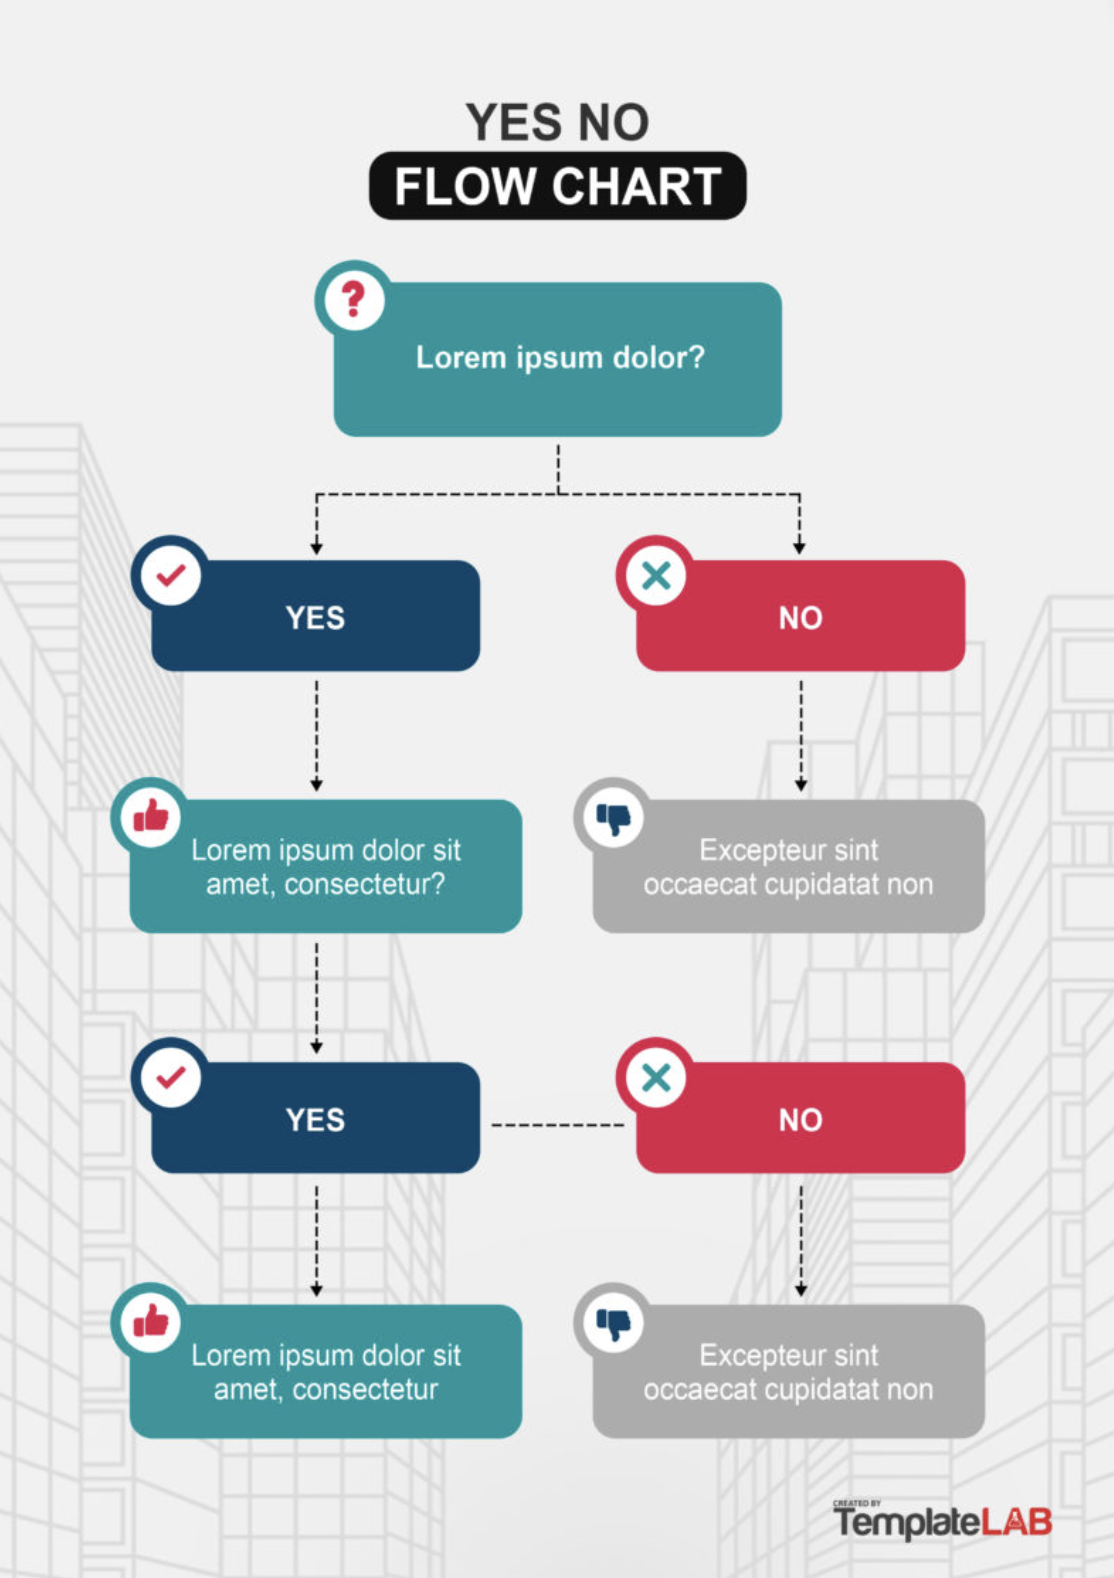
7. Yes – No Flow Chart
This template is a classic decision tree template. It helps the user pragmatically decide the way forward.
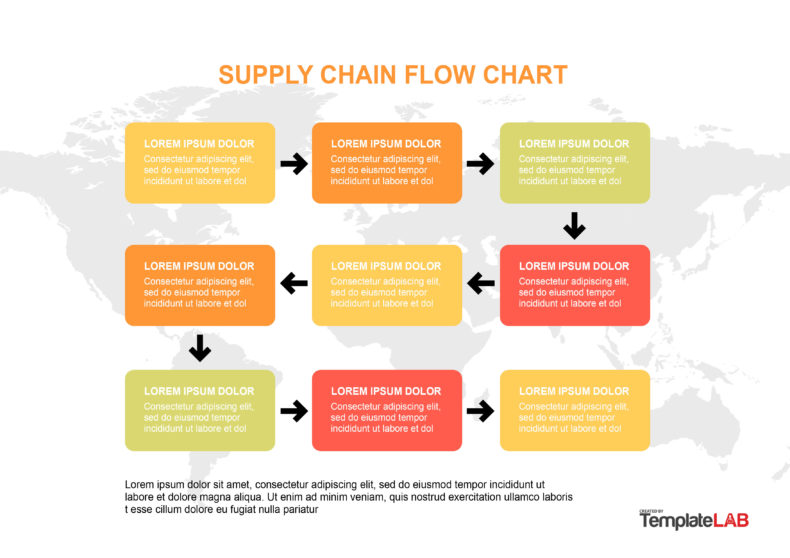
8. Supply Chain Flow Chart
This template visually maps out the journey of products from raw materials to delivery, showing each step and the players involved.
Flow Chart Templates for PowerPoint
PowerPoint has a lot of flexibility, which makes it a popular application for creating and customizing flow charts. Here are eight templates for PowerPoint to help you get started.
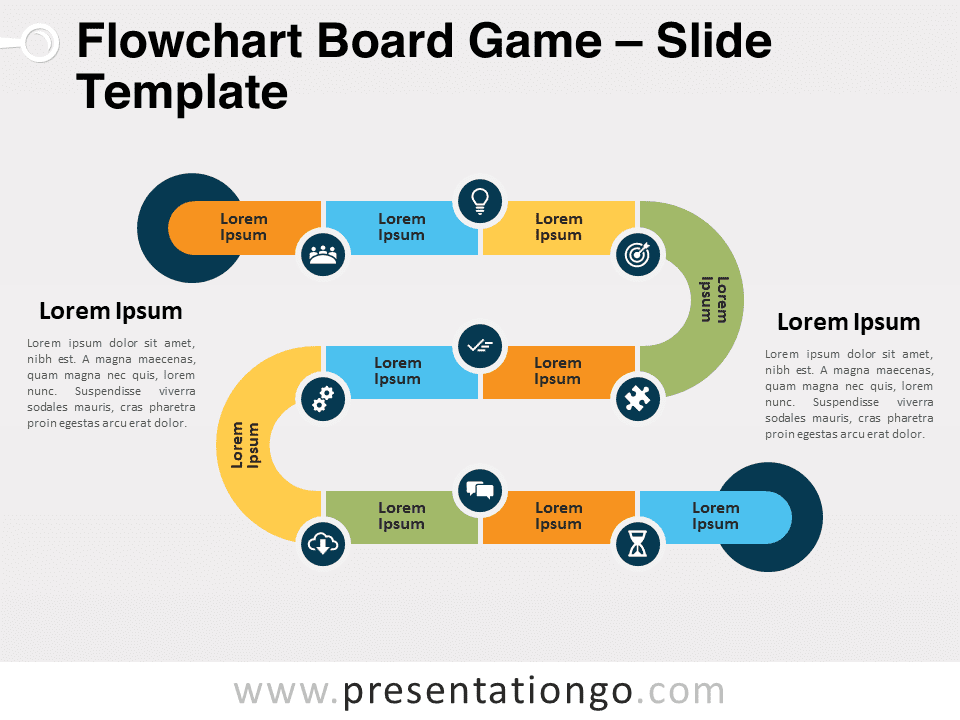
1. Board Game Style Flow Chart
This template is designed like a game board, guiding users through a series of decisions or steps in a fun and engaging manner.
2. Flow Chart Diagram
This template visually represents how a business generates value, delivers products or services, and captures revenue.

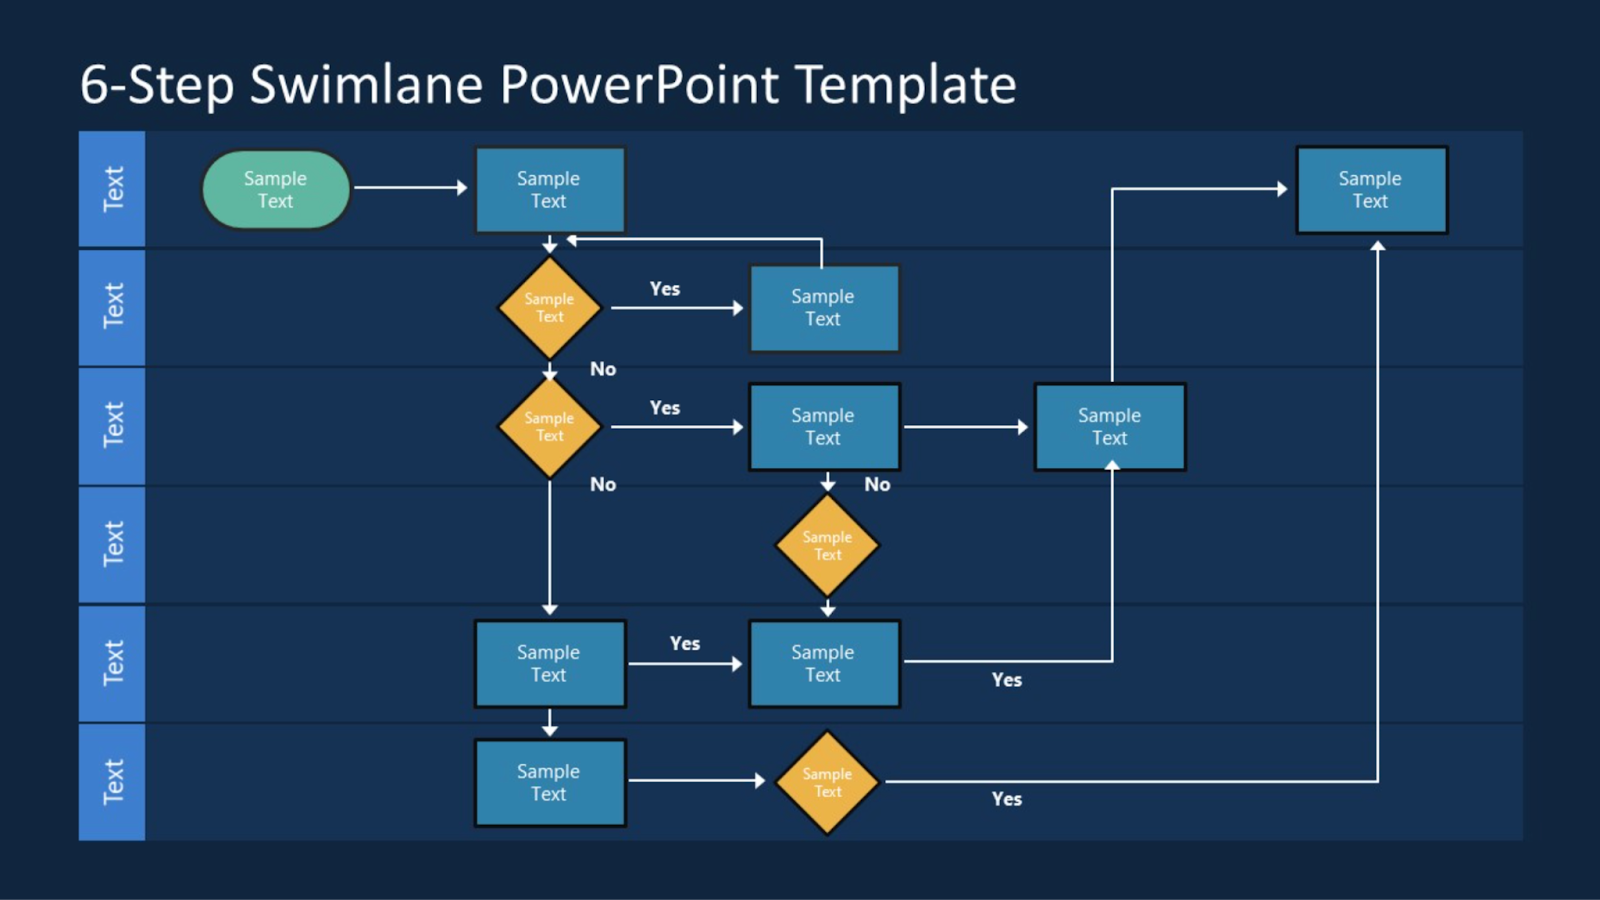
3. 6-Step Swimlane PowerPoint Template
This template visualizes a project or workflow into six distinct lanes or columns, each representing a different stage or department.
4. Data Flow Diagram
A data flow diagram visually illustrates how data flows within a system, showing the processes, data stores, data sources, and data destinations.

5. 5-Step Job Aid Process
This template provides short-hand training information for new employees or interns. It will help them understand what to expect during their training.

6. Bottleneck Flow
This flow chart helps identify areas in a process where work accumulates or slows down, enabling teams to focus on resolving these bottlenecks to move the project forward.

7. Effective Selling Process
This template will help your team visually see the steps involved in the sales journey, from lead generation to closing a deal.

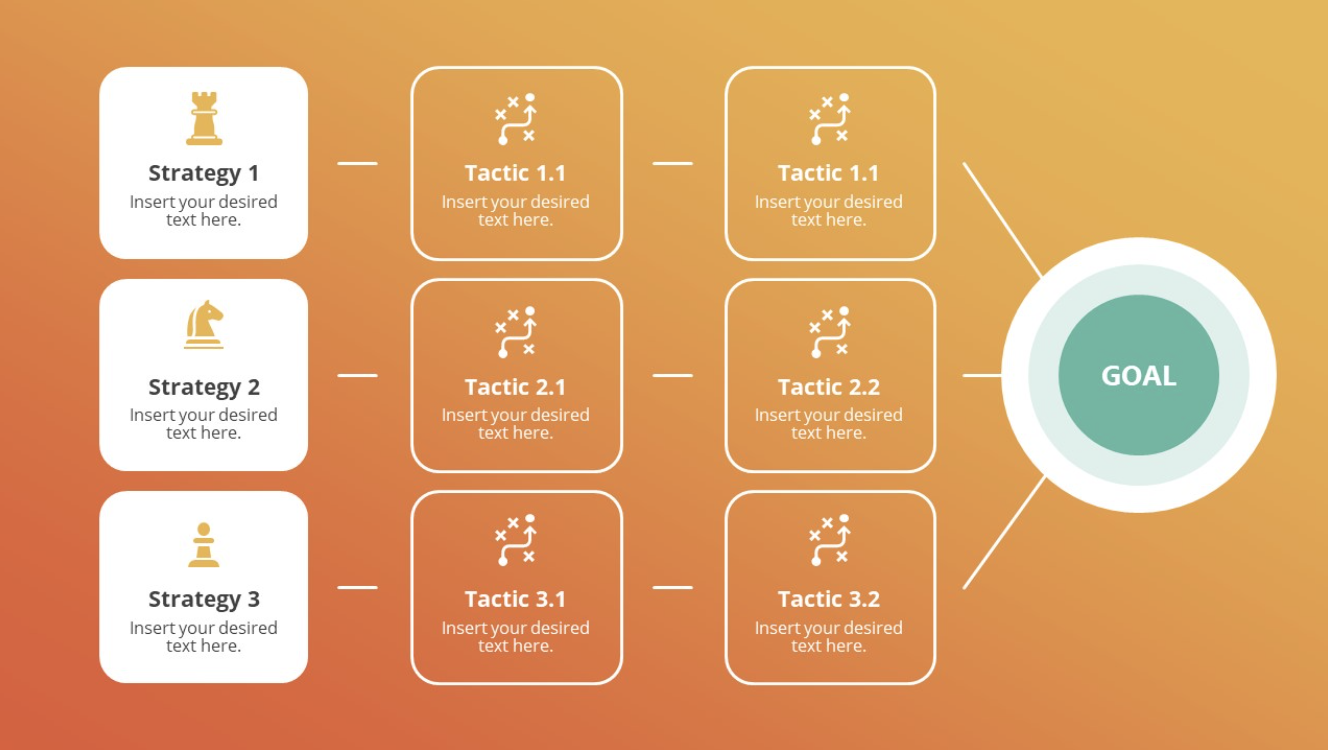
8. Goal Strategy & Tactics
This template outlines the steps for achieving a specific goal, including the overarching strategy and detailed tactics. It helps the team understand how minor actions can contribute to a larger goal.
Flow Chart Templates for Excel
Excel is a favorite tool for many businesses that need to show complex data. It has valuable prompts built in to help you manage large number sets. Here are a few free templates to help you infuse your spreadsheets with flow charts.
1. Work Breakdown Structure
This template offers a hierarchical diagram that breaks a project into smaller, manageable tasks.
2. Decision Tree
This decision tree template can provide a great representation of your decision-making process backed up by data in your Excel spreadsheet.
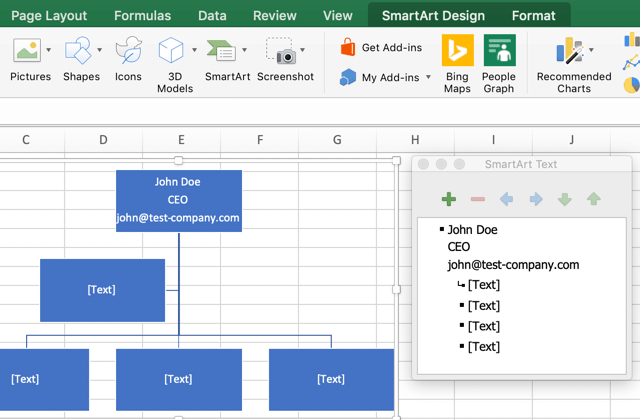
3. Organizational Chart
This template allows you to create and customize organizational charts easily, making it convenient for your business to visualize and communicate your organizational structure.
Flow Chart Templates for Google Docs
These templates make it easy to design professional-looking flow charts directly in Google Docs. Here are two free templates to get you started.
1. Swimlane Chart
This swimlane diagram template will help you visualize and streamline responsibilities across teams.
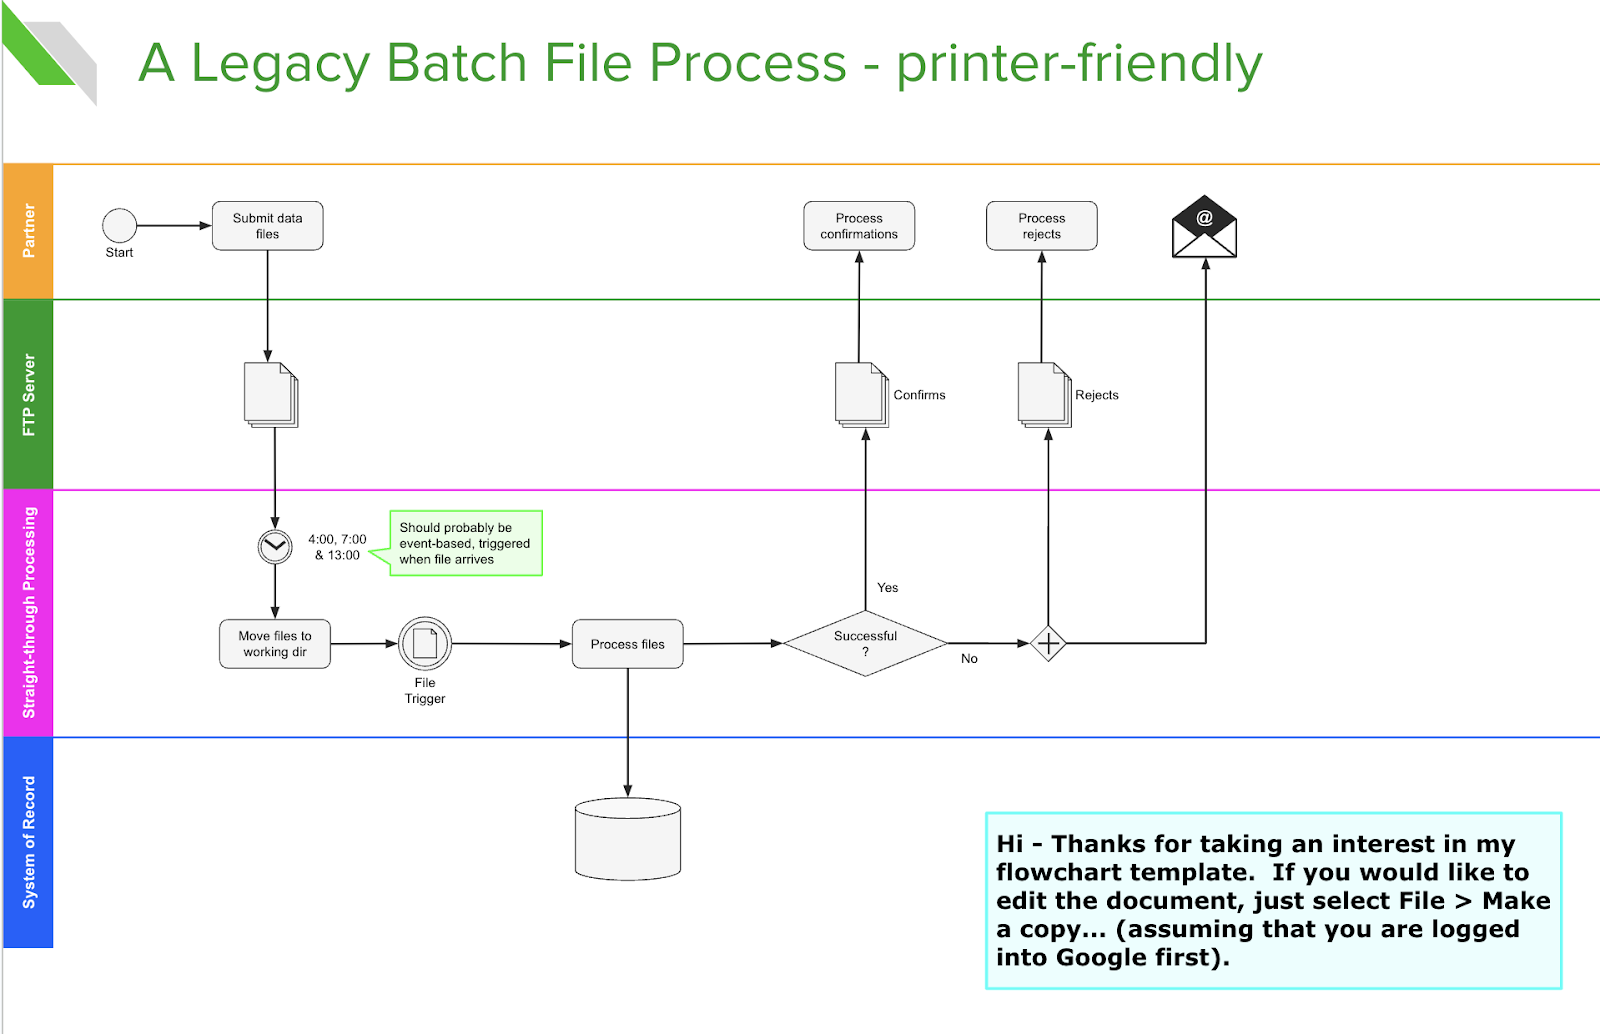
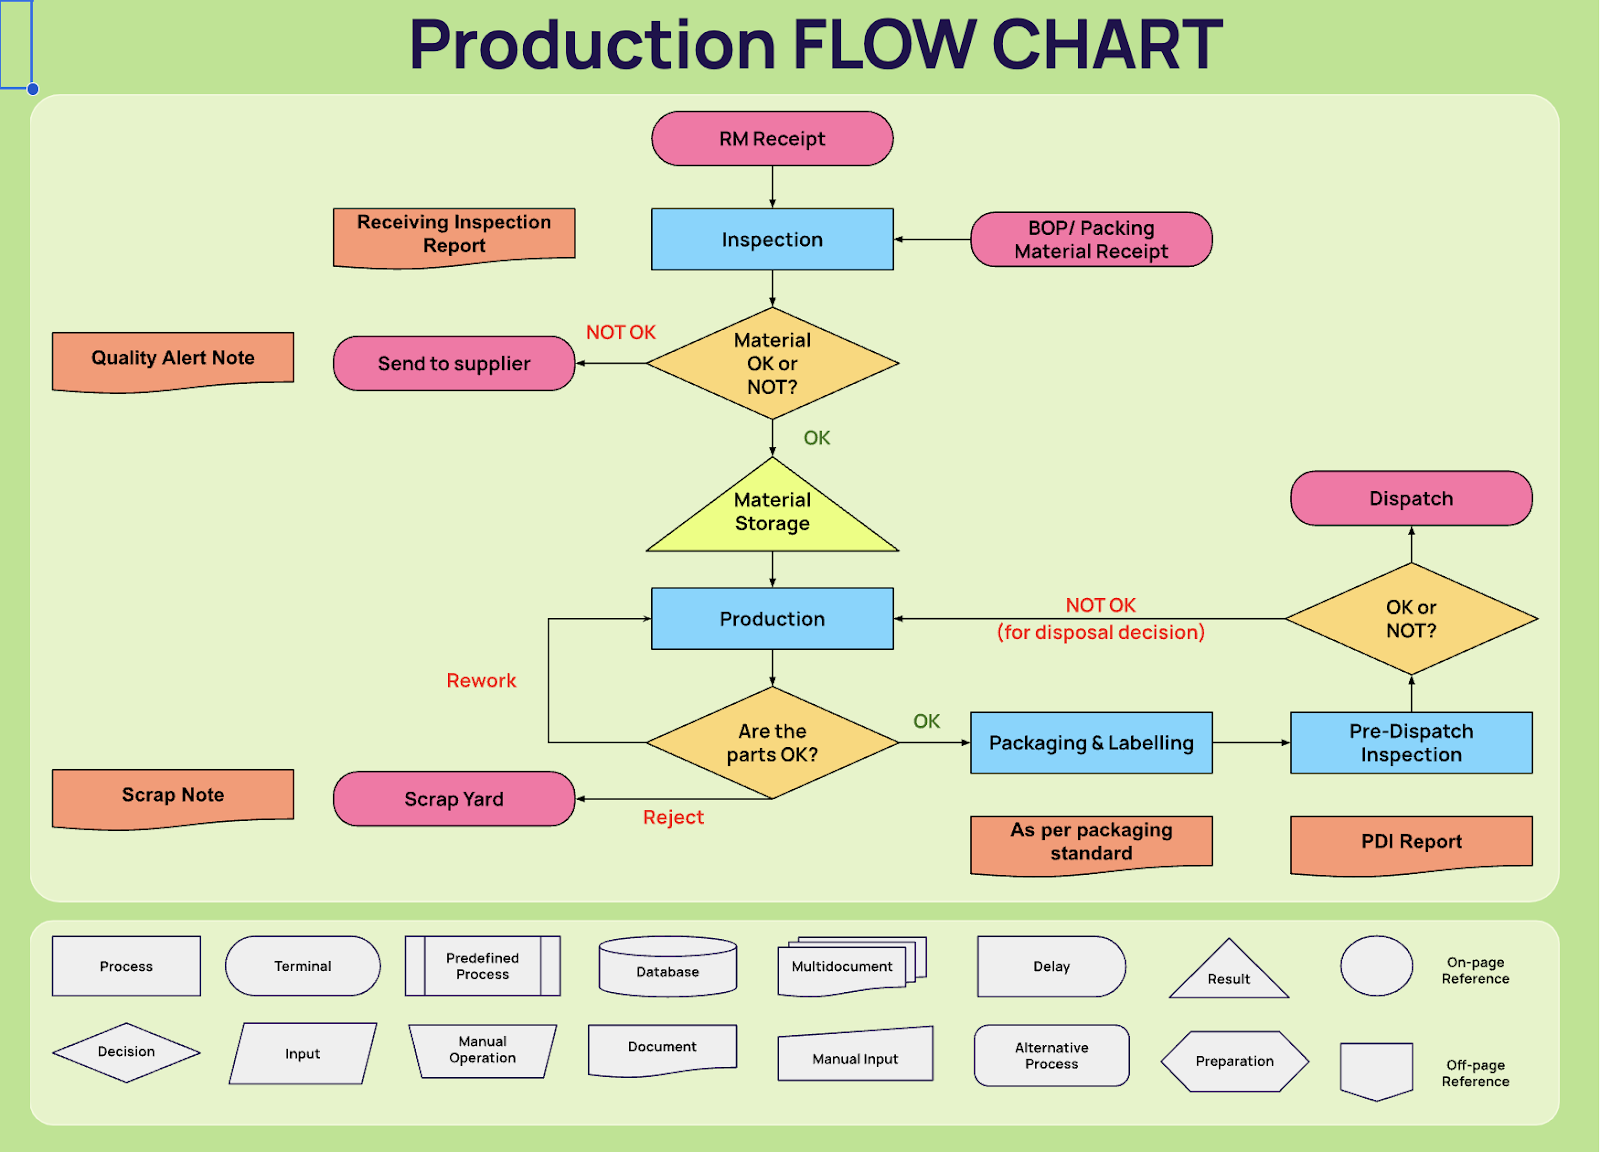
2. Production Flow Chart
This template helps you outline the steps involved in manufacturing a product or delivering a service.
Tips for using flow chart templates
When creating your flow chart, consider key principles to ensure your ideas are communicated effectively.
Customize your flow chart
To create a customized flow chart, start by selecting a template that closely matches the type of flowchart you want to create. Once you have chosen a template, you can customize it by adding your company’s branding elements, such as logos, colors, and fonts, to ensure consistency with your brand identity.
Have a clear strategic objective for your flow chart
Before creating your flow chart, think about the main goal you want to achieve with it. Whether it’s improving a process, making a decision, or communicating a complex idea, having a clear objective will guide your entire flow chart creation process.
For example, if you are a marketing professional, your goal could be to optimize lead generation processes. For this, you’ll need a straightforward document that the whole team can understand, where you can identify bottlenecks and follow a sequential layout. In this case, the process flow chart will work well as it’s easy to interpret and follows a design that helps your team follow the buyer on their journey and identify any parts of the flow where leads drop off.
Ensure that every element serves a purpose
Once you have determined your objective, it’s essential that every element you include in your flow chart serves a purpose in achieving that objective.
It’s crucial to avoid adding unnecessary elements that could clutter the chart and distract from its purpose.
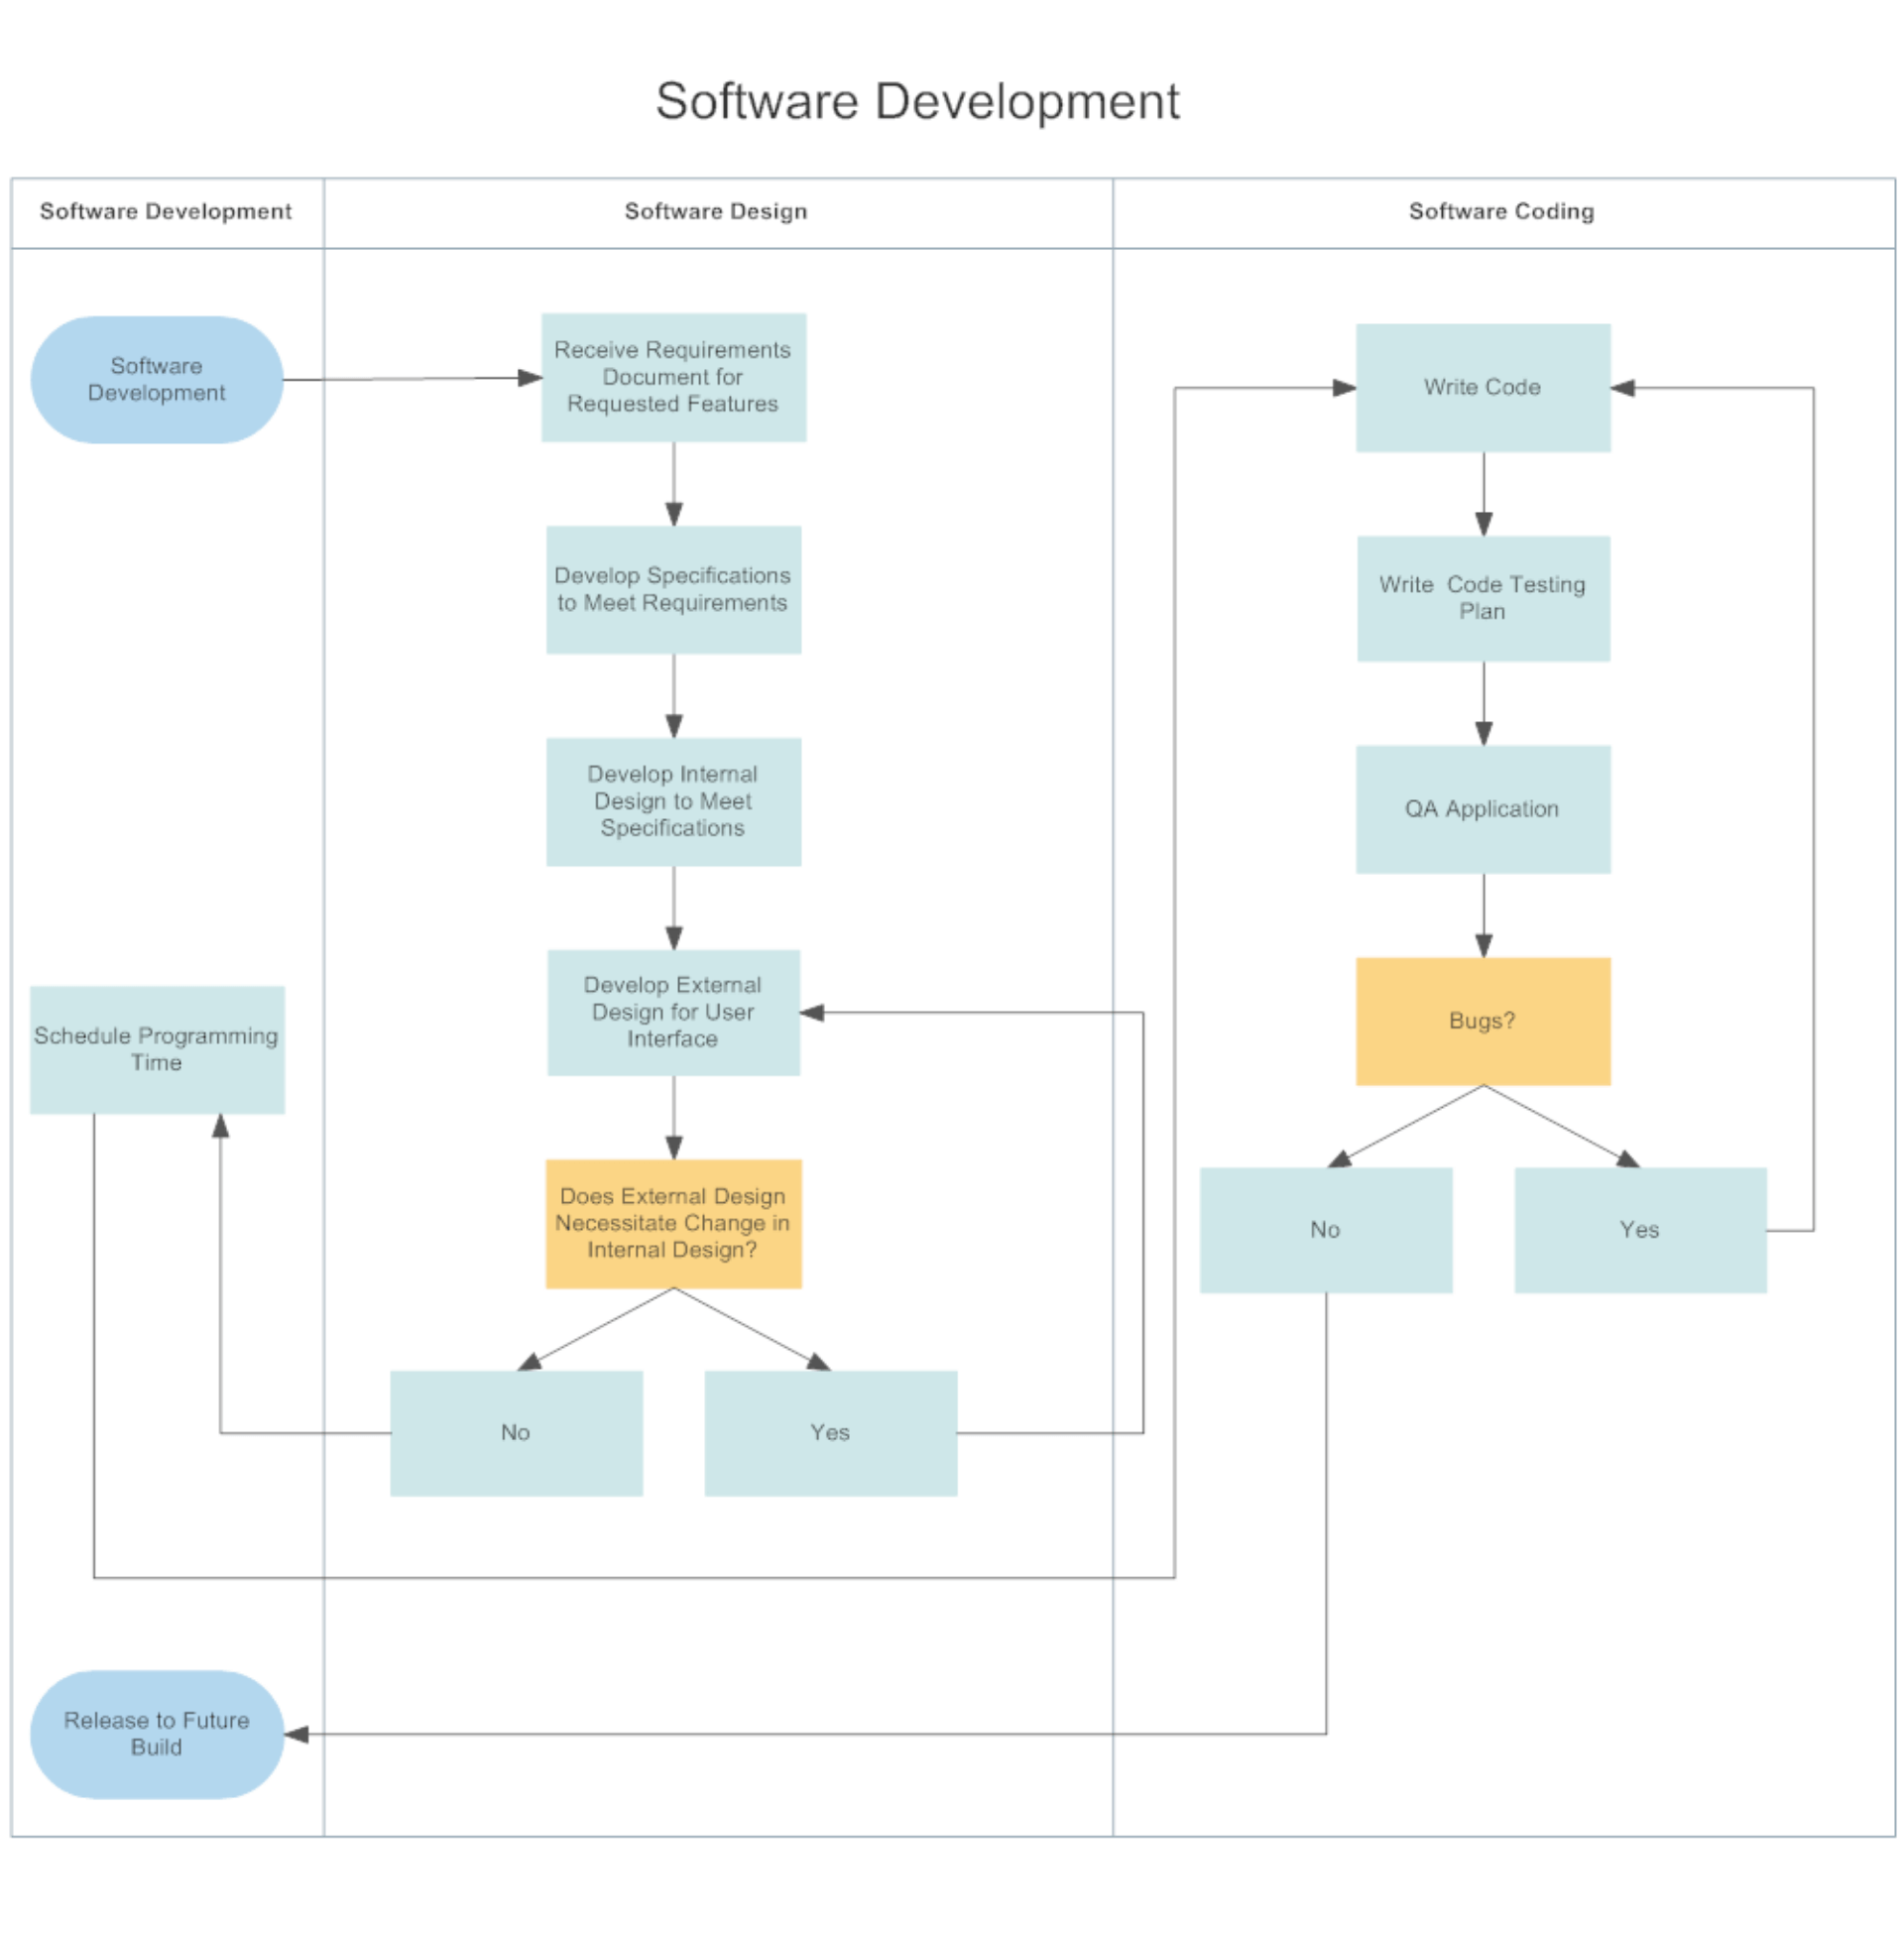
Here is an example of a flow chart with too much unnecessary information.
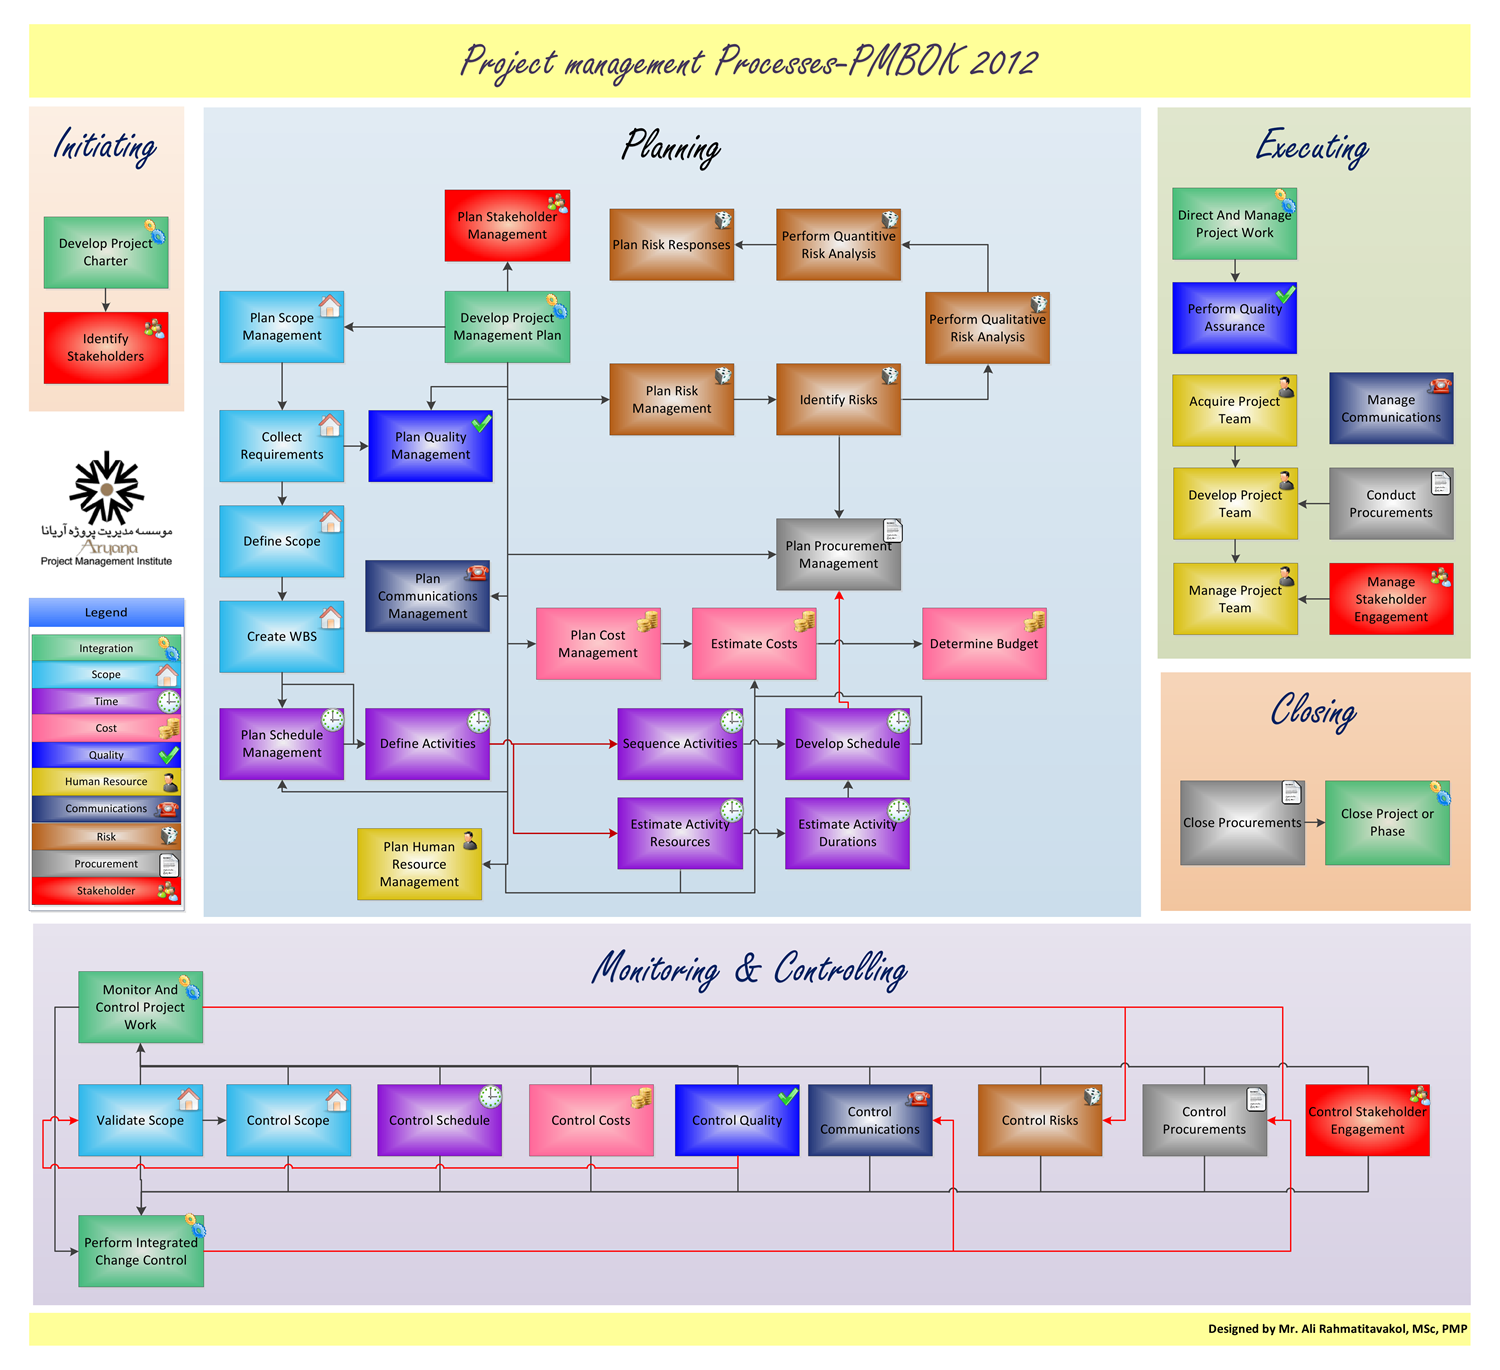
As you can see, it’s tough to understand what this chart is trying to convey for a few reasons:
There are too many colors.
Multiple flows on one sheet don’t have a throughline.
It’s hard to identify where to start and where to end.
The titles also don’t tell us much about the process, so it would be difficult for others in the project to understand the stages.
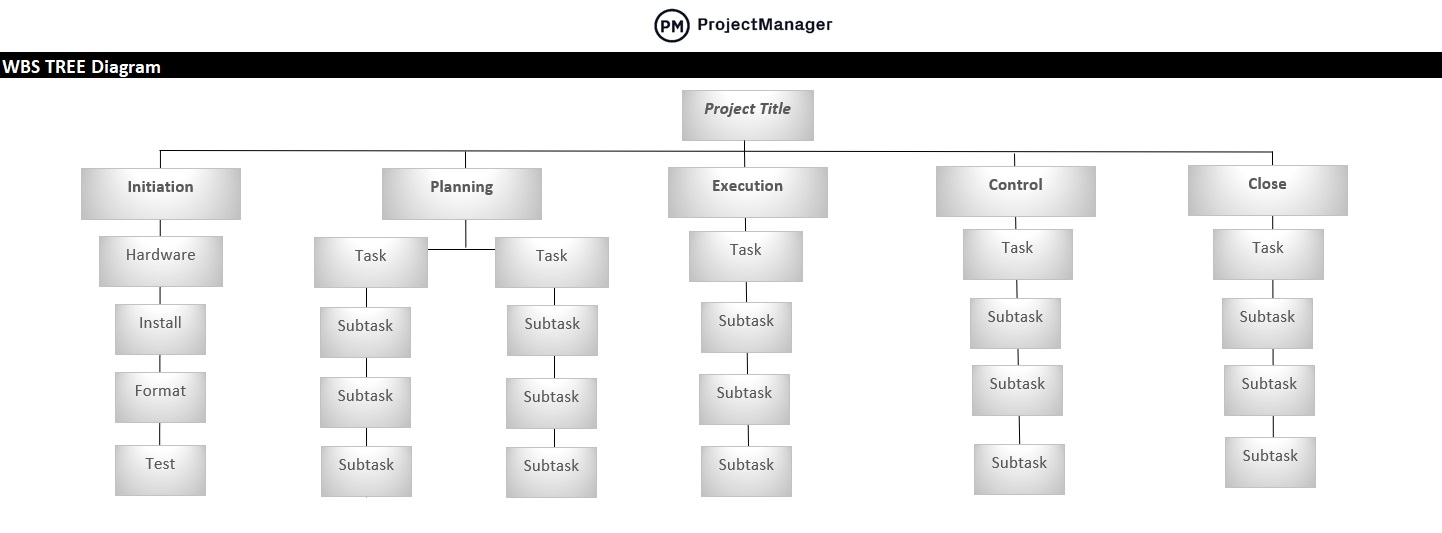
Here’s an example of a flow chart that effectively uses color, symbols, and titles.

This image has four clear stages with four tasks underneath each. The designers have used color to help the viewer understand these different stages, and arrows show that each task is a natural progression through the stages.
Use precise language
Flow charts are meant to simplify complex concepts. Use clear and straightforward language to ensure that your audience quickly understands the information you’re presenting.
Avoid using long titles or complete sentences that might clutter your flow chart and make it harder to understand. Try to pick short words that identify the step that needs to be taken.
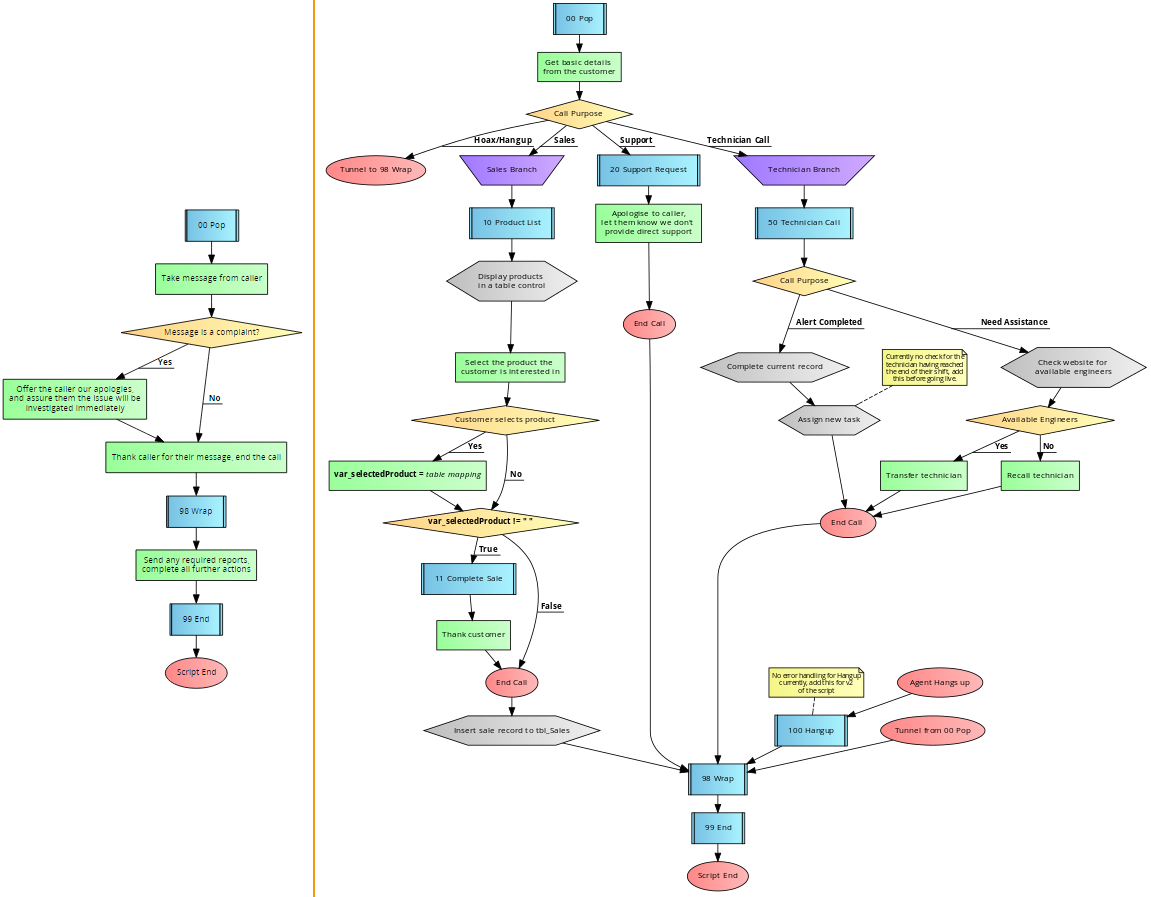
Here’s an example of a flow chart that uses too many words and is hard to understand.
Here is an example of a flow chart showing that less is more when labeling the stages in your flow.

Maintain a consistent design style throughout the chart
When creating a flow chart, it’s important to ensure that it effectively communicates the process to all team members and that everyone understands their roles.
To achieve this, the design should be visually clear and consistent, using the same font, colors, and formatting throughout the chart. This will help to give the chart a polished and professional appearance, while also making it easier to understand and follow.
Templates are a great way to maintain a consistent design as they already have a color pallet, defined symbols, and font. You just need to fill in the details, and you’ll have a professional flow chart in no time!
Here is an excellent example of a beautiful and consistently designed flow chart.

Highlight critical decision-making areas
If your flow chart contains key decision points or critical areas, use visual cues like colors or annotations to make them stand out.
This way, your audience can quickly identify and focus on the most crucial parts of the flow chart.
Here’s a great sales flow example; it clearly shows the decision in the blue diamonds and has strong ticks or crosses to help the viewer navigate it.
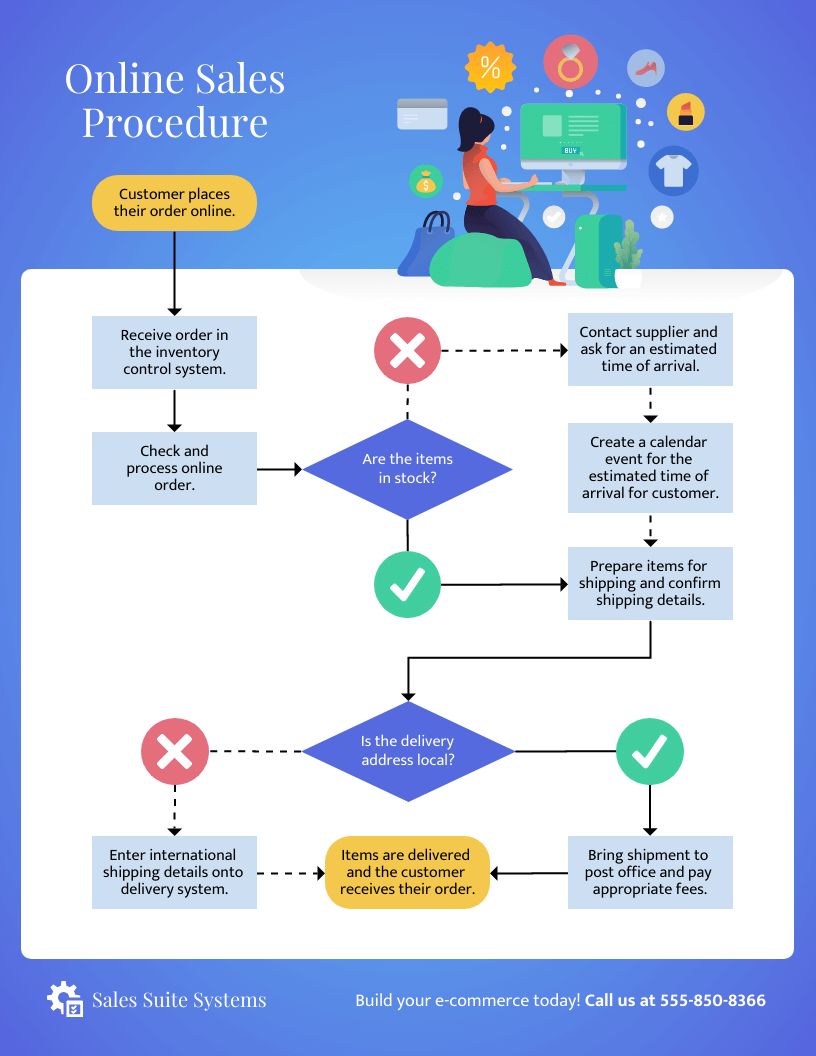
This is particularly important for a sales document as the user might be on the phone with a prospect, and a flow that is easy to follow will be necessary to keep their conversation going and feel confident about what to say next.
Iterate and refine the flow chart based on feedback
Creating a flow chart is often an iterative process. Gather input from colleagues or experts, and use that feedback to refine and improve your flow chart until it effectively communicates the intended information.
A beautifully designed flow chart is one thing, but it will all be for nothing if your audience can’t follow it. When making a flow chart, it’s hard to know if your flow will be clear for an outsider to understand, so ensure consistent feedback from your stakeholders when you use your chart.
Add interactive elements to your flow charts
Interactive flowcharts allow viewers to engage with the chart by hovering over or clicking on specific elements, such as decision points, tasks, or milestones, to reveal additional information, explanations, or links to relevant resources.
For example, you can add pop-up boxes that provide detailed descriptions of each step, tooltips that offer quick explanations when users hover over symbols or hyperlinks that direct users to related documents or websites for more information.
This interactive approach not only makes the flowchart more engaging but also provides users with a deeper level of insight and context, making it easier for them to grasp complex processes or decision points.
Conclusion
Flow chart templates can be incredibly useful in taking your presentations to the next level and effectively conveying your message to your audience. With Piktochart’s free account, you can easily create striking and dynamic flow charts that will make your message stand out and drive desired outcomes.
Don’t settle for plain and generic flow charts. Sign up for a free Piktochart account now and gain access to a plethora of customization options, professional designs, and flexibility that will elevate your presentations and help your business grow. By following the strategic approach we’ve outlined, you can transform the template into a tailored tool that serves your specific purpose, and Piktochart is the perfect platform to help you achieve that.
So if you want to create visually appealing flowcharts, don’t wait any longer. Click the link below and get started with Piktochart today.
FAQ
Where can I create flow charts?
You can create flow charts in Piktochart (sign up here) or using the templates linked above in Word, PowerPoint, Google Docs, or Excel.
Does Google Docs have a flow chart template?
Google Docs doesn’t have a built-in template. Instead, it offers shapes you can insert to build your chart from scratch.
This isn’t ideal if you are in a hurry and want your chart to look nice. For the best results, we recommend using one of the templates linked above or starting a free account with Piktochart.
Is there a flow chart template in Excel?
No, Excel does not have inbuilt flow charts. However, this article includes templates you can use to get started and customize to your liking.
What are the best flow charts for engineering teams?
Engineering teams can significantly benefit from utilizing various flow charts, such as process charts, decision trees, data flow diagrams (DFD), cause-and-effect diagrams, and organizational charts.
Process charts can be a lifesaver when it comes to documenting workflows and standardizing procedures in product development or quality control areas. They help simplify complex processes, making them easier to understand and follow.
Decision trees are a great tool for evaluating design options and making data-driven decisions. They can be especially useful for tasks like selecting materials or optimizing designs.
If you’re working on software development or system architecture, data flow diagrams are an essential part of the process. They can help you better understand data processes and dependencies.
Lastly, cause-and-effect diagrams can be valuable assets when analyzing the root causes of defects or failures. They can help identify areas for quality improvement, ultimately helping you create better products.
What are the benefits of using flow charts at my business?
Flowcharts simplify complicated processes, identify bottlenecks, standardize procedures, improve collaboration, track progress, facilitate decision-making, and communicate ideas effectively. They are a valuable asset for any organization looking to streamline their processes and improve efficiency.
How can I ensure that my flowchart is easy to understand for others?
Use clear and concise language, avoid cluttering the flowchart with unnecessary elements, maintain a consistent design style, highlight critical decision points, and gather feedback from colleagues or stakeholders to refine and improve the flowchart’s clarity and effectiveness.