The Piktochart team surveyed 1000+ business professionals around the globe, representing various industries, brands, and company sizes, to unearth insights and statistics in graphic design for businesses.
We asked them about how they use graphic design in their respective industries, their workflows, their biggest challenges, and how the pandemic impacted their graphic design decisions.
We also looked at the impact of graphic design on their overall business goals.
Here’s a summary of our findings:
81% of business organizations reported using graphic design in various formats.
Out of the 19% of companies that don’t use it, 67% would make graphic design assets if there was an easier and more cost-effective way to do it.

- 50% of the respondents increased their budget for graphic design projects and tools in 2021 compared to the previous year.
- The top 5 visual content formats used by businesses and companies in 2021 are: social media graphics, presentations, flyers, brochures, and posters.
Keep reading to uncover more interesting graphic design statistics and insights. You can skip ahead to a specific section by clicking a link below.
- Purpose of the survey
- Demographics
- Why businesses use graphic design
- Top benefits of graphic design for businesses
- How businesses use graphic design: Formats, platforms, and social channels
- How the pandemic affected the use of graphic design among businesses
- Average graphic design budget by businesses
- What the graphic design process is like for businesses
- Challenges and hurdles of businesses in terms of graphic design projects
- Graphic design statistics by industry and departments
- How HR and recruiting teams use graphic design
- How marketing and sales teams use graphic design
- How finance teams use graphic design
- How healthcare teams use graphic design
- How SaaS teams use graphic design
- How shipping and logistics teams use graphic design
- How telecommunications teams use graphic design
- How retail teams use graphic design
Purpose of the survey: Is graphic design still relevant for businesses right now?
In our graphic design trends report early this year, we described 2022 as the year of creative pragmatism for graphic design and visual communication.
We also talked about the trends to look out for, such as 90s retrofuturism icons, abstract asymmetrical backgrounds and patterns, and experimental typography.
After reviewing graphic design portfolios, talking to graphic designers, and publishing our findings on trends, we became more curious about the current state of graphic design in businesses.
This time around, we wanted to learn more about graphic design processes and usage among businesses, particularly in the B2B space.
In addition, we wanted to gather more data to help us make data-informed decisions in designing products for business storytelling like Piktochart Visual and Piktochart Video.
However, we couldn’t find any new B2B graphic design statistics, so we conducted our own survey in December last year.
Survey demographics: Who responded to the survey?
In December 2021, 1101 respondents from 10 countries completed our survey. These countries are:
- US
- UK
- Mexico
- Canada
- Germany
- Australia
- France
- Ireland
- Italy
- Netherlands
Here’s a breakdown of the organizational roles of the respondents:
- Middle management – 39%
- Owner/partner – 26%
- C-level/President – 19%
- Director- 19%
- Senior management – 7%

Why businesses use graphic design
Communicating more effectively with customers is the key reason why businesses use graphic design tools or hire graphic designers.
The top 3 reasons of businesses in using graphic design are:
- 55% of businesses use graphic design to communicate better with customers
- 24% of businesses use it to drive social media engagement
- 19% of businesses use it to communicate internally

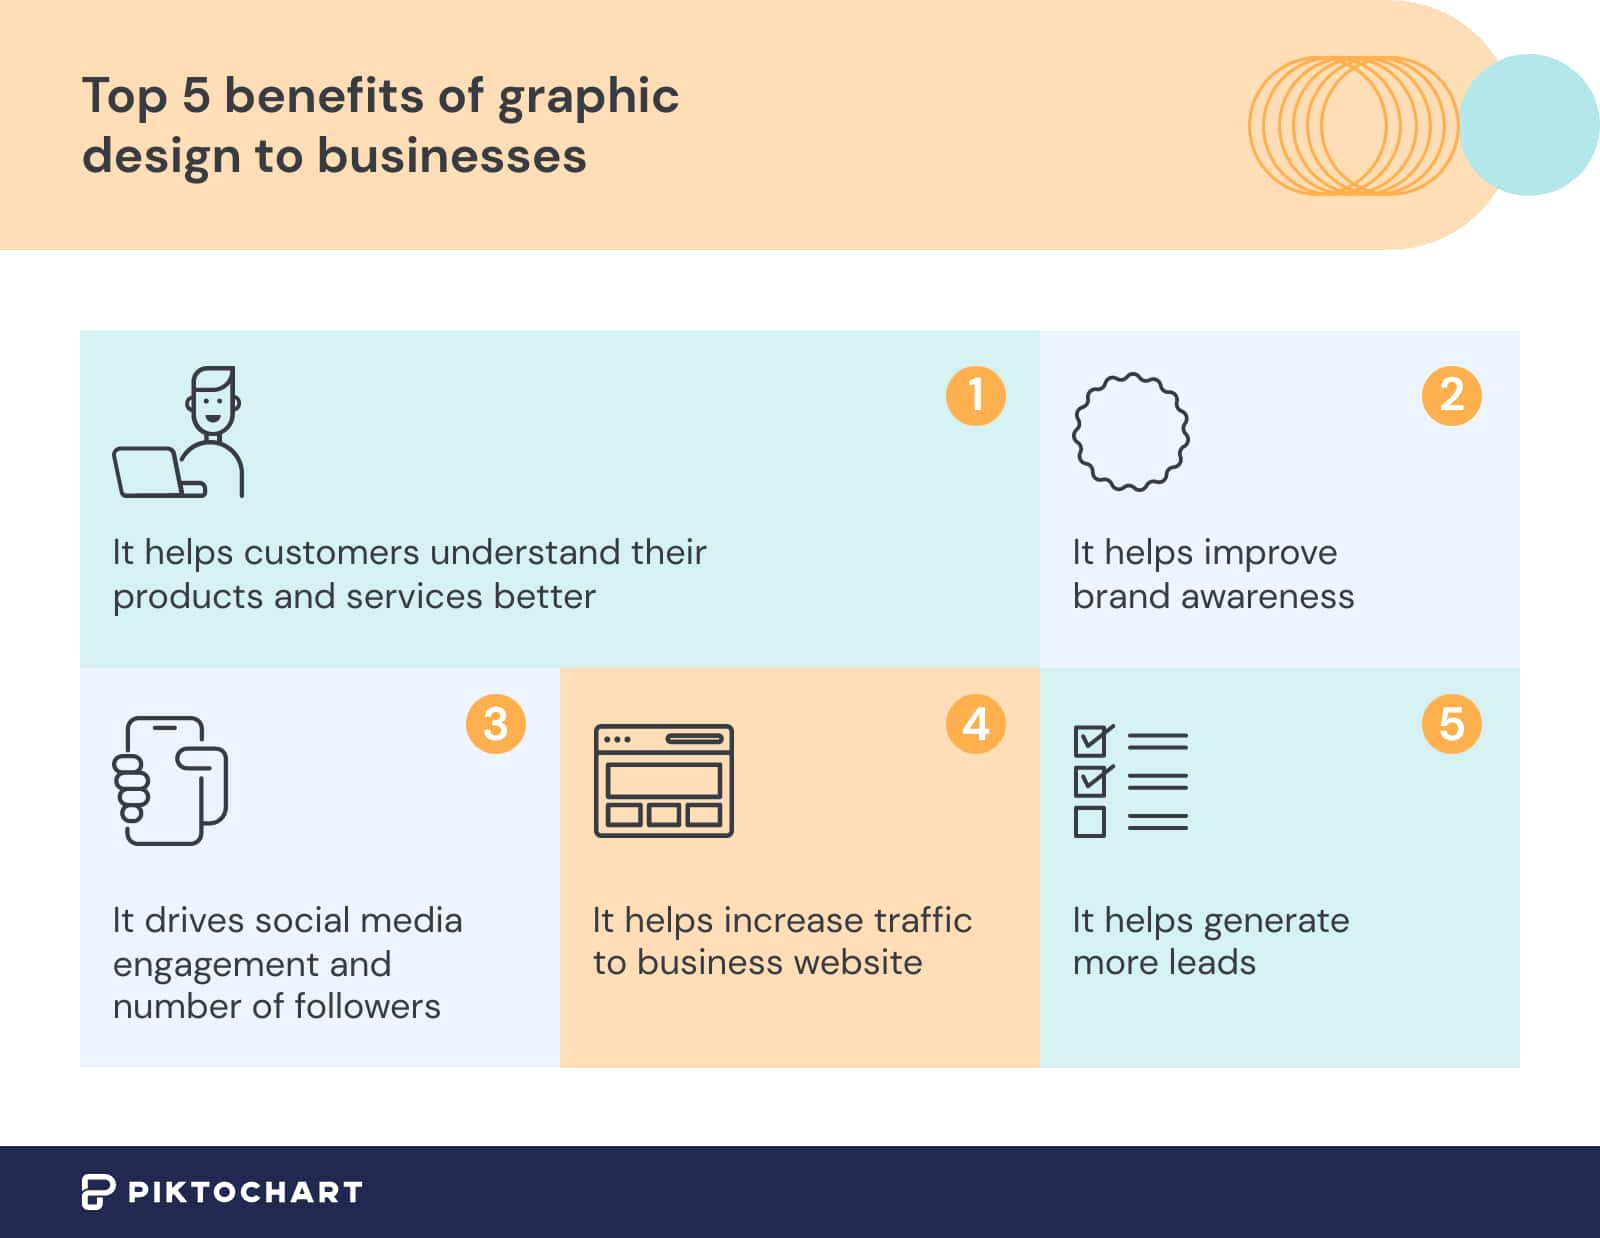
Top benefits of graphic design for businesses
Based on the survey responses, the benefits of graphic design for businesses are:
- Helps customers understand their products and services better
- Drives social media engagement and number of followers
- Helps improve brand awareness
- Helps generate more leads
- Helps increase traffic to business website
How businesses use graphic design: Formats, platforms, and social channels
As mentioned earlier, the top 5 visual content formats used by businesses and companies in 2021 are social media graphics, presentations, videos, flyers/brochures, and posters.

Where do these businesses share these visuals?
- Social media, emails, and print are the top 3 platforms where businesses share visuals and graphic design assets.

- The most popular social channels for sharing graphic design assets in 2021 are Facebook (32%), closely followed by Instagram (31%). YouTube was at 16% while LinkedIn was at 12%. Twitter got 9% of the social media shares.

How the COVID-19 pandemic affected the use of graphic design among businesses
For 50% of the survey respondents, the pandemic increased the number of visuals they created.
Meanwhile, 19% of the respondents created fewer visuals, and 31% made about the same number of visuals as before the pandemic.

Annual graphic design budget by businesses
- 32% of businesses surveyed have an annual graphic design budget between $1000 and $5000, while the same number of respondents (32%) have a budget between $5000 and $10000

- 50% of the respondents increased their budget for graphic design projects and tools in 2021 compared to the previous year. On the other hand, 29% of businesses responded that their graphic design budgets stayed the same, while 21% of companies had to cut down on graphic design costs.

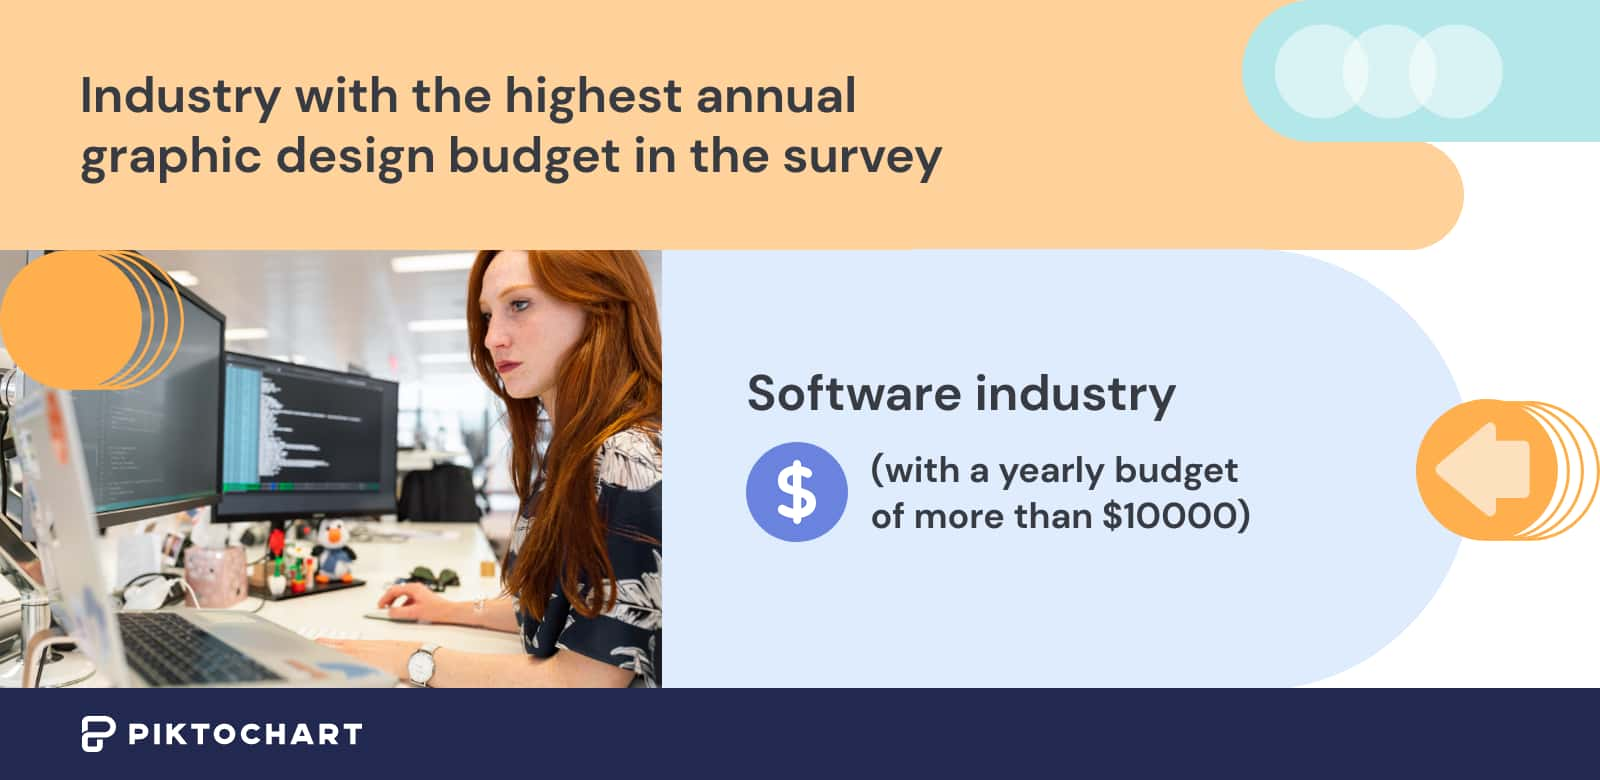
- Businesses in the software industry have the highest annual graphic design budget in the survey, with a yearly budget of more than $10000.
What the graphic design process is like for businesses
- 49% of businesses agreed that they have a relatively smooth graphic design process but also admitted that coordinating between teams in their graphic design workflows is taking much of their time. 17% find their processes cumbersome and time-consuming.

- According to 61% of organizations surveyed, their graphic design process involves 2-5 people

- 41% of businesses have an in-house graphic designer to address their graphic design requirements. 35% go the DIY (do-it-yourself) route, and 24% outsource their graphic design needs

Challenges of businesses in terms of graphic design projects
The biggest pain points of businesses in terms of graphic design projects are:
- Design has to go through too many approval steps – 34%
- It takes too long to get the design done – 24%
- Not enough collaboration among team members in coming up with new ideas – 15%
- Not enough skills to create graphic design assets quickly – 12%
- Existing graphic design process isn’t creative enough- 12%
- Others (e.g. can’t afford software) – 3%

Graphic design statistics by industry and departments
Here’s a deeper dive of the survey findings based on industry and departments.
How HR and recruiting teams use graphic design
- The top 3 content formats where HR and recruiting teams use graphic design are: presentations, videos, and reports.
- 39% of HR professionals created more visuals and graphic design assets during and after the pandemic
- 41% of HR teams created their designs in-house
- 56% of HR teams increased their graphic design budgets in 2021
- Biggest benefit of graphic design for HR teams: It helps drive engagement in their social media posts
- HR teams’ biggest graphic design challenge: Not enough skills to create graphic design assets quickly

How marketing and sales teams use graphic design
- The top 3 content formats where marketing and sales teams use graphic design are: social media graphics, videos, and presentations.
- 36% of marketing and sales departments created more graphic design assets during and after the pandemic
- 43% of marketing and sales teams increased their graphic design budgets in 2021
- Marketing and sales teams’ biggest graphic design challenge: Design has to go through too many steps for approval
- Instagram is the top social channel for sharing graphic design assets among marketing and sales teams

How finance teams use graphic design
- The top 3 content formats in finance where graphic design is used are: presentations, social media graphics, infographics and posters (tied for third place).
- Biggest benefit of graphic design in finance: It helps their customers understand their products and services
- 52% of finance teams created more visuals and graphic design assets during and after the pandemic
- 62% of finance teams said they increased their graphic design budget in 2021
- Biggest graphic design challenge for finance teams in 2021: Too many steps to get approval in the graphic design process
- 41% of finance teams created graphic design assets in-house with a dedicated graphic designer.
- Facebook is the top social channel for sharing graphic design assets among finance teams

How healthcare teams use graphic design
- The top 3 content formats where graphic design is used in healthcare are: social media graphics, presentations, flyers and brochures (tied for third place).
- 62% of respondents in healthcare said that visuals and graphic design assets have helped their customers understand their products and services
- 54% of healthcare teams created more visuals and graphic design assets during and after the pandemic
- 44% of healthcare respondents said they increased their graphic design budget in 2021
- Average annual graphic design budget in healthcare is $5000- $10000 ( one of the industries with the highest budget among survey respondents)
- Biggest graphic design challenge for healthcare teams in 2021: It takes too long to get the graphic design assets done
- 47% of healthcare teams create infographics in-house with a dedicated graphic designer
- Facebook is the top social channel for sharing graphic design assets among healthcare teams

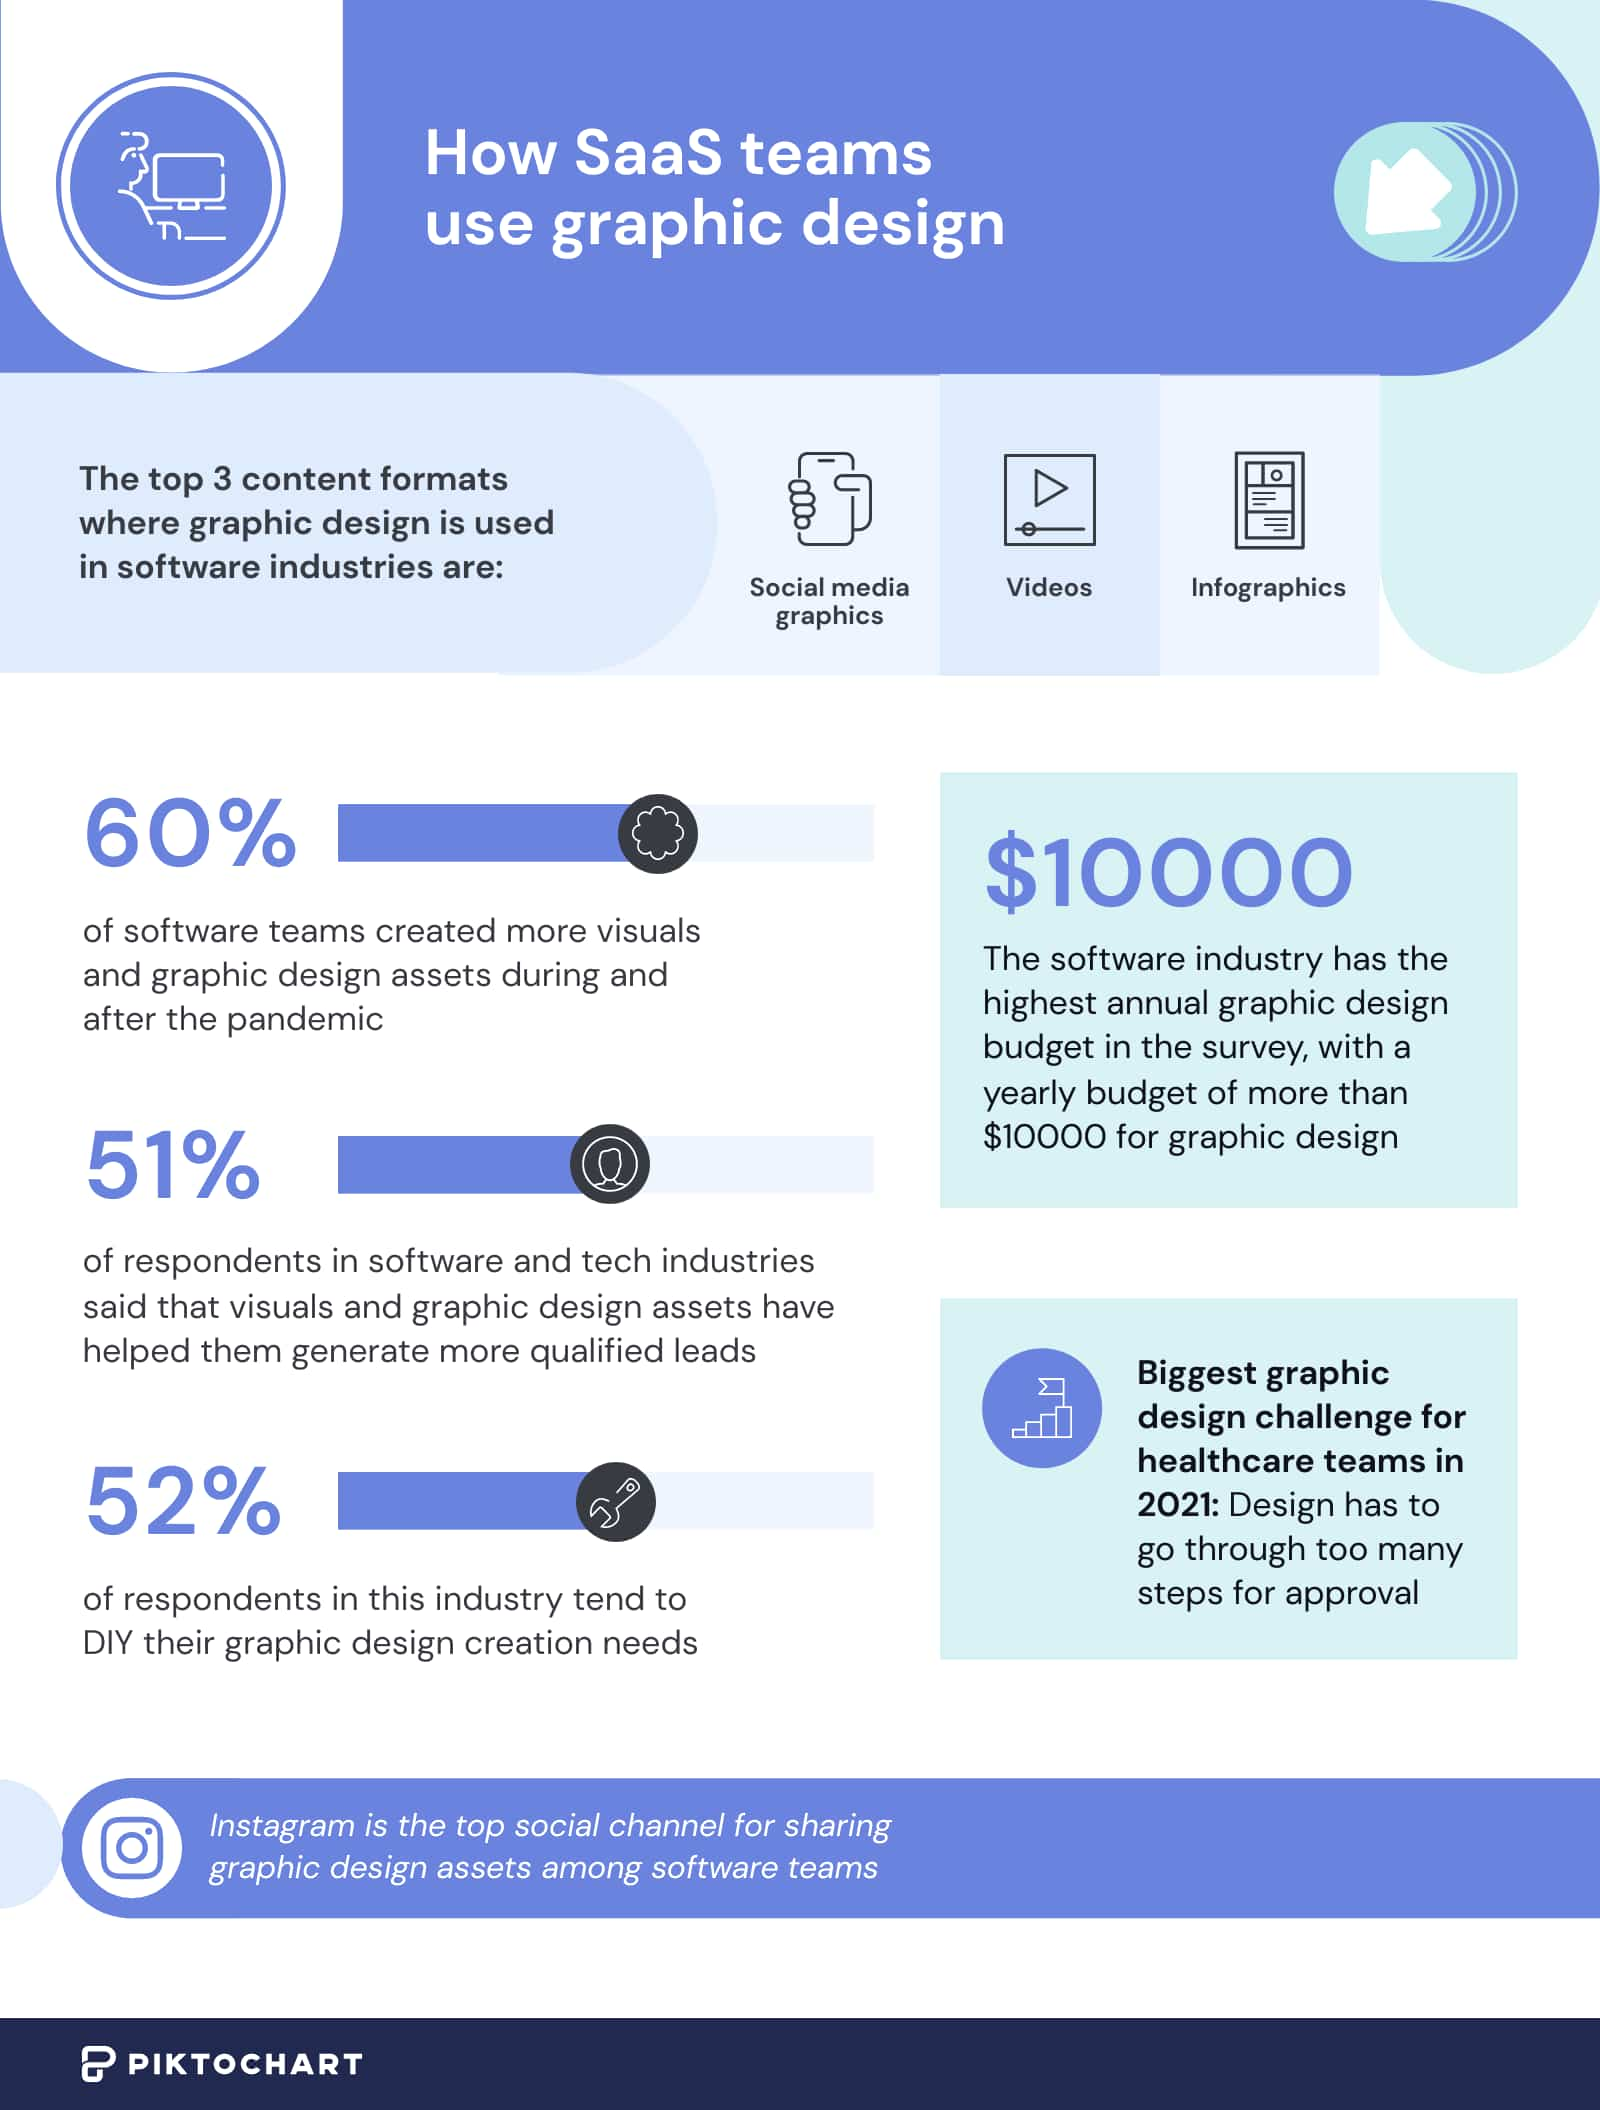
How SaaS teams use graphic design
- The top 3 content formats where graphic design is used in software industries are: social media graphics, videos, and infographics.
- The software industry has the highest annual graphic design budget in the survey, with a yearly budget of more than $10000 for graphic design.
- 60% of software teams created more visuals and graphic design assets during and after the pandemic
- 51% of respondents in software and tech industries said that visuals and graphic design assets have helped them generate more qualified leads
- Biggest graphic design challenge for healthcare teams in 2021: Design has to go through too many steps for approval
- 52% of respondents in this industry tend to DIY their graphic design creation needs
- Instagram is the top social channel for sharing graphic design assets among software teams
How shipping and logistics teams use graphic design
- The top 3 content formats where graphic design is used in shipping and logistics are: presentations, flyers and brochures, infographics and social media graphics (tied in third place).
- Biggest graphic design challenge for shipping and logistics teams in 2021: It takes too long to get the design done
- Facebook is the top social channel for sharing graphic design assets among shipping and logistics teams
- 83% of the respondents in the shipping and logistics team agreed that graphic design has helped their customers understand their products better

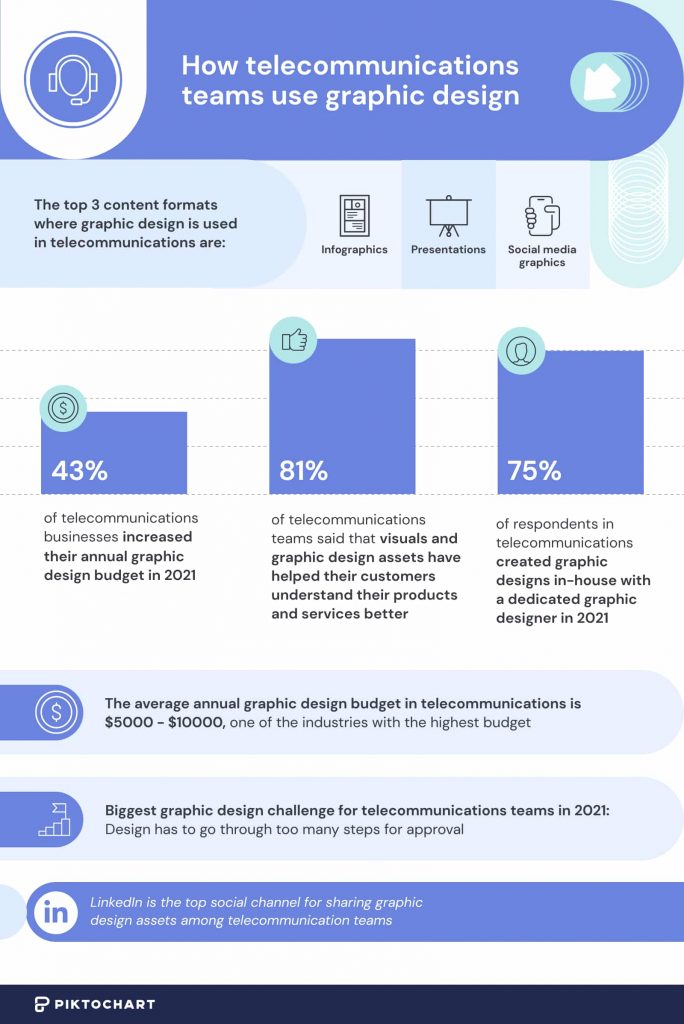
How telecommunications teams use graphic design
- The top 3 content formats where graphic design is used in telecommunications are: infographics, presentations, and social media graphics.
- The average annual graphic design budget in telecommunications is $5000 – $10000, one of the industries with the highest budget
- 43% of telecommunications businesses increased their annual graphic design budget in 2021
- 81% of telecommunications teams said that visuals and graphic design assets have helped their customers understand their products and services better
- Biggest graphic design challenge for telecommunications teams in 2021: Design has to go through too many steps for approval
- 75% of respondents in telecommunications created graphic designs in-house with a dedicated graphic designer in 2021
- LinkedIn is the top social channel for sharing graphic design assets among software teams
How retail teams use graphic design
- The top 3 content formats where graphic design is used in retail are: presentations, posters, and social media graphics.
- 57% of retail businesses said that visuals and graphic design assets helped them improve brand awareness in 2021
- Biggest graphic design challenge for retail teams in 2021: Design has to go through too many steps for approval
- 57% of retail teams created graphic designs in-house with a dedicated graphic designer
- Instagram is the top social channel for sharing graphic design assets among software teams

Is your business or organization one of the 67% who would make graphic design assets if there was a more accessible and more cost-effective way to do it?
Piktochart is the all-in-one visual storytelling platform you’re looking for. Try it for free.