Every teacher wants their students to fully understand the concepts taught in class. However, you may encounter topics that are difficult to teach and understand. It is necessary to employ an innovative approach in order to assist students in comprehending a challenging subject.
Graphic organizers are powerful tools that make complex concepts easier to teach and understand. They also help students develop visual literacy skills. Teachers find graphic organizers helpful for explaining difficult concepts, and students find them engaging. Graphic organizers are also great for presenting research data if, for example, the teacher wants to share a case study with students.
Now, what if you could quickly find and customize graphic organizers without spending hours brainstorming from scratch?Because there is a sea of engaging templates to choose from, you can create compelling visuals with just a few clicks. These graphics can be used for a number of different purposes, including teaching. With Piktochart, you can access and customize engaging graphic organizer templates in minutes – no design skills required. Simply create a free account to get started.
In this article, we will look at the 12 graphic organizer examples that greatly assist teachers and help students retain information for a longer period of time.
What is a Graphic Organizer?
Graphic organizers are tools that help visually organize information and complex concepts in a way that is easy to understand and memorize. Graphic organizers effectively organize and visualize information by creating links between concepts or facts. By visually illustrating the relationships between concepts, graphic organizers make it easier to analyze and internalize information, making them excellent tools as study guides.
We know that every mind works differently. Presenting information in a systematic, visual format enables students to follow along at their own pace and grasp relationships more easily than via verbal explanation alone. They can also be an invaluable tool for visual learners.
12 Graphic Organizer Examples for Different Learning Objectives
There are countless types of graphic organizers out there, as information can be organized and visualized in many different ways. We’ll focus on 12 of the most helpful types of graphic organizers for teachers and students, organized by the primary purpose each one serves.
Graphic Organizers for Brainstorming and Organizing Ideas
Some graphic organizers are specifically great for organizing ideas for brainstorming. Here are three examples.
Mind Map
Mind maps are graphic organizers that organize information in a structured and visually attractive fashion. When a mind map is finished, you will get a structure that looks like a spider web. An example of the graphic organizer is the following mind map on Piktochart. It shows the values of a company, with different values branching out from the central idea, that is, company values.
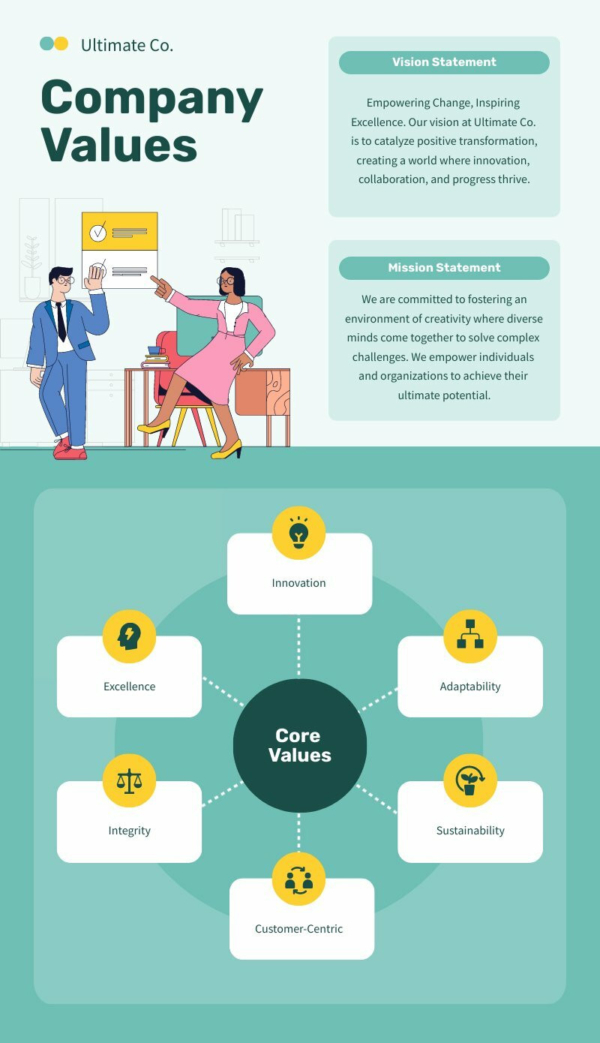
We all know that information retention can become quite difficult, especially when a number of different subtopics link to one main topic. A student could use a mind map to break down the taxonomy of living things, with ‘Organisms’ in the center, ‘Kingdoms’ branching out one level, ‘Phyla’ branching out from each ‘Kingdom’ and so on.
Concept Map
Concept maps are another type of graphic organizer that excels at representing hierarchical information. They use boxes or circles to represent different concepts, with lines or arrows labeled to illustrate the relationships between them.
Concept maps have many uses in educational settings. They help in the sequential understanding of different concepts for students. For example, if a teacher has to break down a country’s government structure, he or she will most likely use a concept map to show the branches and subbranches of different government institutions systematically.
Cluster Diagram
Cluster or cloud diagrams help brainstorm different ideas around a main concept. This type of graphic organizer is called a cluster because the topic or ideas related to the main idea form a cluster around it. For example, a cluster diagram can assist students determine how much they know about a topic and what areas need further research.
This type of graphic organizer is very useful when generating ideas for a project or planning its different phases. Cluster diagrams break down a complex subject into smaller parts, both for individuals and for groups, for example, during defining scope of a project in its early stage.
Graphic Organizers for Comparing and Contrasting
The next type of graphic organizer helps you to compare two or more concepts. You can use this organizer to compare and contrast ideas, people, events, and policies. For instance, say you’re teaching a unit on different forms of government. You could use a compare and contrast graphic organizer to help students parse out key similarities and differences between a democracy and a dictatorship. This type of graphic organizer will be your go-to option.
It is important to know that when you use this type of graphic organizer to compare two concepts, you are covering both the similarities and differences between those concepts. However, with contrast, only the differences are mentioned. Some examples of this category of graphic organizers are given below.
Venn Diagram
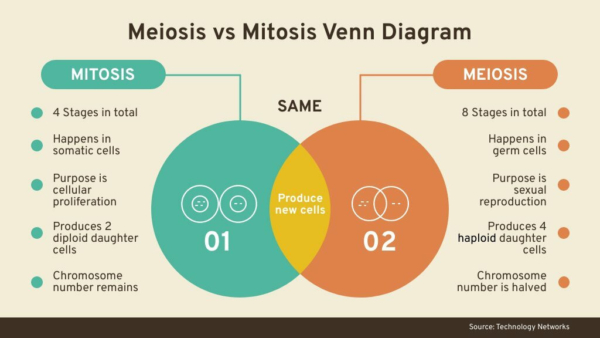
A Venn Diagram usually comprises two to three overlapping circles. The commonalities between the concepts are written in the shared or overlapping area, whereas all the distinct or unique features are mentioned in the part of the circle that does not overlap with any other circle.
For example, you could have your students draw Venn diagram for the fruits and vegetables that red or orange. The common area between the two circles will contain vegetables like tomatoes that come in both these categories. The Venn diagram below shows the comparison of mitosis and meiosis.
T Chart
Another brilliant graphic organizer for comparing and contrasting is the “T Chart.” A T-chart is simply a table with two columns, usually comparing two items or ideas, or sorting data into categories. This type of graphic organizer is super quick to create and easy to understand, especially for students. T charts can also be used to categorize and jot down pros and cons.
The T chart is a popular option for both teachers and students because its layout is straightforward, and it offers a wide array of functions. For example, if the students are planning to go on a field trip but are not able to choose a location, then T charts can help a great deal.
Teachers can ask the students to make a T chart of potential places and list the advantages and disadvantages of each of the locations in their respective columns. Also, a T chart is a great graphic organizer to show upsides and downsides of a topic.
Graphic Organizers for Sequencing and Cause-Effect
Next on the list are graphic organizers, which show the sequence or timeline of events. Sequence and timeline graphic organizers are particularly useful for teachers when presenting events in chronological order is important. Some of the graphic organizers that help students visualize the relationships between steps in a process or links in a chain of events are as follows.
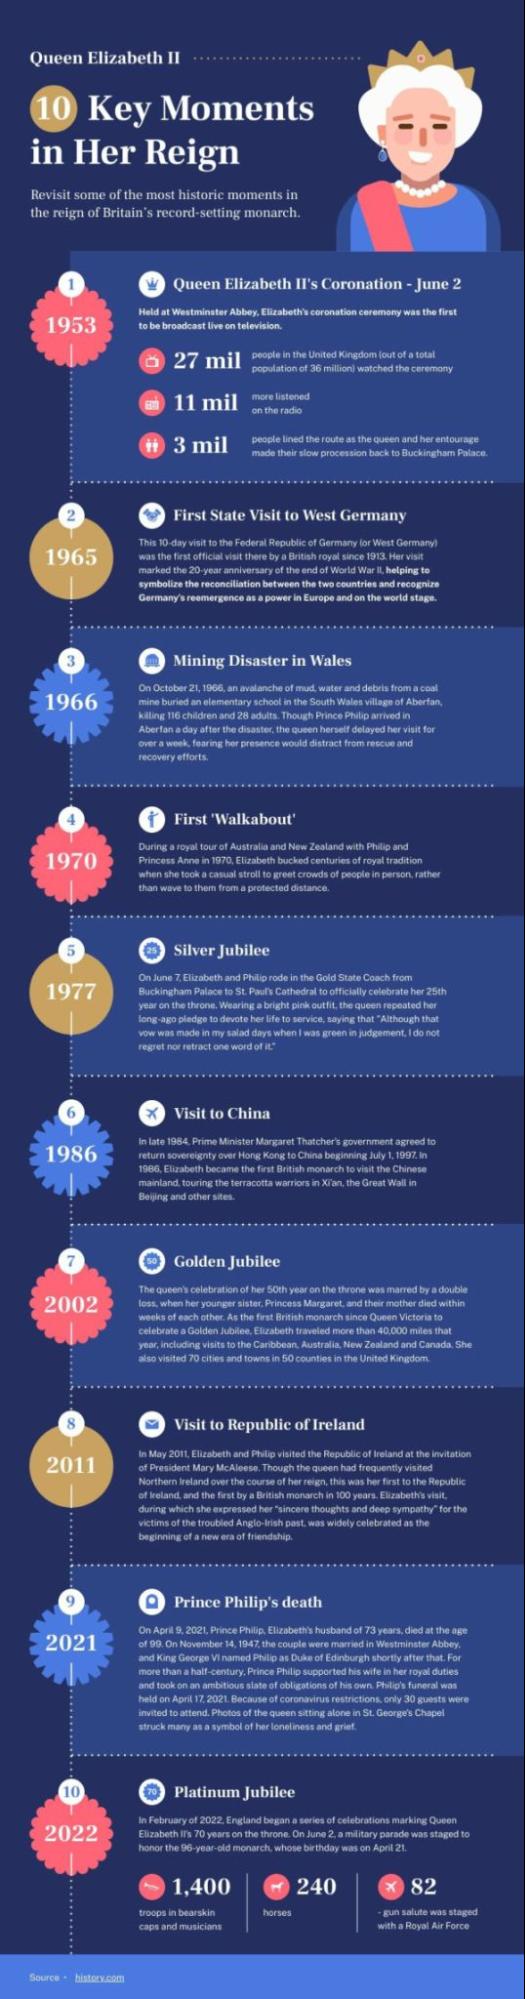
Timeline
A timeline graphic organizer shows a sequence of events in chronological order. History subjects make great use of timelines . Because major historical events can be shown in a proper sequence using a timeline. Along with dates, timelines give the flexibility to mention locations as well. For example, a timeline of the American Revolution could chart major turning points like the Boston Tea Party, the signing of the Declaration of Independence, and the Battle of Yorktown.
Timelines can also be used to show how a certain phenomenon has progressed over time, such as a business’s growth. The Piktochart timeline template below charts key events in the life and reign of Queen Elizabeth II. Notice how the combination of images and concise text makes the chronology engaging and easy to follow.
Flowchart
This type of graphic organizer shows the steps of a process and how all the steps combine in a sequence to make the process happen. Flowcharts systematically and clearly document and communicate how a process works and what steps are involved in it, from start to finish. When a process is mapped using a flowchart, potential areas or steps of improvement can be identified.
Cause and Effect Diagram
As the name suggests, a cause-and-effect diagram groups those causes of a problem that either have already happened or might happen. Relationships between different contributing factors can also be shown using a cause-and-effect diagram.
Often referred to as an Ishikawa diagram, or a fishbone diagram, a cause-and-effect visual is one of the basic tools of quality. While often associated with root cause analysis in business and manufacturing, cause-and-effect diagrams are equally powerful for getting to the bottom of issues in the classroom. By mapping out all the potential contributing factors to a problem, students can start to identify patterns and actionable solution.
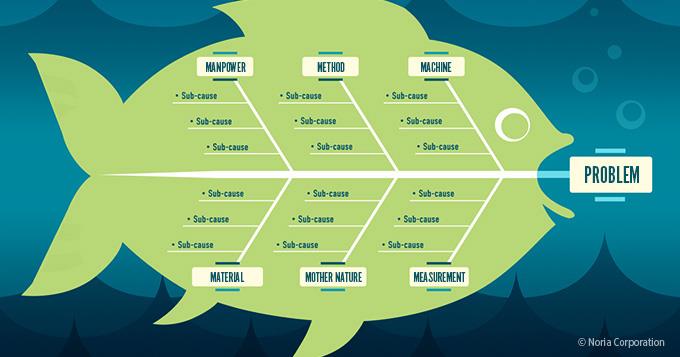
Source: Noria Corporation
Graphic Organizers for Main Idea and Supporting Details
This category of graphic organizers shows a main idea and its supporting ideas. It defines and visualizes a core concept and all its supporting details. It is a great tool that helps students develop an outline of a topic for better understanding. Some of the examples are given below.
Main Idea Web
This type of graphic organizer starts with a main idea and branches out into related sub-ideas. The key point behind web graphic organizers is sometimes referred to as a light bulb. It is predominantly used to brainstorm ideas for writing purposes. For example, if a student wrote a report on photosynthesis, they could put “photosynthesis” in the center, then branch out to related subtopics like ‘chloroplasts’, ‘light-dependent reactions’, etc.
Herringbone Diagram
A herringbone diagram is used when processes are involved. This type of web organizer helps you break down variations in a process or causes that lead up to an effect. A herringbone diagram is particularly important for avoiding an event before it happens.
Graphic Organizers for Writing and Note-taking
Another group of graphic organizers we’ll explore focuses on writing and note-taking. Writing, especially essays, proves challenging for many students as they struggle with arranging ideas. Here are a couple of graphic organizers for writing, which can be of great help to you.
Essay Map
Essay writing is an important skill that students use throughout their lives. An essay map graphic organizer is a brilliant tool for students, as it helps them to chalk out the outline in a systematic manner without missing any detail. Once a student is done with his or her essay map, writing becomes a walk in the park.
Cornell Map
This graphic organizer is a popular technique for note-taking. Particularly during lectures and textbook reading, the Cornell Map template comes in handy as it helps students to jot down all the important ideas and information systematically. It usually has a cue column, a note-taking column, and a summary section.
When students are taking notes, the key ideas, important dates, formulas and other such details would go into the “note-taking” column. They will add questions, cues, and headings in the “cue” column. Whereas, the “summary” section will include a summary of the notes as one or two key learning outcomes. This helps students identify important details when they revise their notes later on.
Tips for Using Graphic Organizers Effectively
It is important for teachers to use graphic organizers in a manner that maximizes the chances of effective learning. Some of the tips to make sure a graphic organizer effective are given below.
- Simple is Always Better—Your graphic organizers must always be simple. This will help students learn quickly. For example, avoid complete sentences unless absolutely necessary.
- Offer a Variety of Graphic Organizers – Expose your students to different types of graphic organizers day-to-day. This will bring out the best in them in terms of creativity.
- Use the to Assess Student Learning – Give the students a task along with a graphic organizer focused on the skill in focus. Use their graphic organizers to assess their standing in the class.
- Use them Frequently—Using graphic organizers frequently helps students internalize what is being taught. The more often students use these tools to engage with content, the more adept they’ll become at using them independently.
Conclusion
A graphic organizer is a tool for teachers to explain complex problems to their students. Similarly, graphic organizers help students visualize the information being taught in class.
There are different graphic organizers, each suited to a specific purpose or thinking process. Whether it’s brainstorming ideas, comparing and contrasting, sequencing events, mapping out an essay, or taking structured notes, there’s a graphic organizer that can help.Teachers can encourage their students to generate ideas by using graphic organizers in their lessons. Students can use graphic organizers to enhance their writing skills.
Piktochart is a one-stop solution that lets you create your own graphic organizer within seconds. It has both one-pager templates and multi-pager templates to cater to all kinds of requirements. Sign up on Piktochart now and make learning fun!