Capturing and keeping a customer’s attention is becoming more difficult than ever. This means that traditional text-based marketing methods like blogs are having less of an impact and businesses are looking at alternative ways to generate exposure.
Messages are often lost, content goes unread, which ultimately leads to a downturn in clicks, traffic, and conversions.
The solution? Infographic marketing. Infographics have the power to grab your customer’s attention, make a lasting impression, and contribute to your wider marketing strategy through their shareability and SEO potential.
In this guide, you’ll learn what makes infographics so beneficial, along with tips, tools, and examples to start leveraging infographics in your content strategy today.
What is Infographic Marketing?
The Cambridge Dictionary defines an infographic as:
“A picture or diagram or a group of pictures or diagrams showing or explaining information”
Although the description is a little clunky, it’s an effective summary.
Instead of writing paragraphs of text interspersed with the occasional image, infographics compress info into a highly readable form usually with a combo of text, images, iconic, and diagrams. The resulting item is an image file (usually a JPEG or PNG) that you can then insert into your marketing media, social media posts, and web content.
Building from this, we can now understand the purpose of infographic marketing:
Infographic marketing is using infographics to promote your business/products/services
This type of visual content is incredibly effective when integrated into a content marketing campaign, as it helps provide important info in a more digestible format. As a visual alternative to long-form blog posts or web pages, infographics are ideal for audiences looking for quick takeaways.
They serve as a focal point that immediately grabs user attention while their compact and compressed format means you can easily convey the most important messages you want customers to take away.
Benefits of Using Infographics in Your Marketing
The strength of infographics is their ability to turn a complex topic into something simpler, while still retaining its meaning and impact. These creative pieces offer multiple benefits aside from their visual appeal including sharability, SEO, and increased brand awareness.
1. Makes Information Easy to Digest and Retain
The picture superiority effect states that images are easier to remember than words which is why infographics are so useful. By combining text and images in a palatable infographic format, content becomes easier to consume and remember compared to walls of text.
2. Can Easily be Shared on Social Media
Infographics by nature are easier to share – you can post one on Facebook and people can read it in less than a minute, compared to a video or blog article which is more time-consuming. It’s also easy to add social sharing buttons to your infographics so they can be widely dispersed on platforms like X, and Instagram.
This goes one step further than sharing a web page or blog article though as infographics can be embedded in social media posts. An embedded infographic stands out far more than a simple URL and thus can garner more exposure.
3. Useful for Your SEO Campaigns
Infographics can be used as part of your SEO campaign by creating backlinks (A backlink is a link on an external website that points back to your site or infographic), adding primary and secondary keywords, and including alt tags. They provide another form of content marketing that complements your web pages, blogs, and social media posts, thus boosting the strength of your overall SEO effectiveness.
4. Helps Improve Brand Awareness and Authority
High-quality infographics are naturally more shareable and you can capitalize on this by including your branding such as color schemes, logos, and taglines, thus boosting brand awareness. The more your infographics are shared, the more your brand sticks in people’s minds.
Similarly, if your infographic marketing content is high-quality, engaging, and useful, you will raise your brand authority within your industry. Consumers will notice the quality of your infographics and see that you are a trusted voice who freely shares their expert information. As the original creator of frequently-shared infographics, you start to stand out as a voice of authority too – someone they can turn to as an industry thought leader.
5. Extends the Usefulness of Existing Content
Infographics can be used to repurpose existing content. For example, perhaps you have a blog article about one of your products. You could create a shareable infographic or distilling key takeaways from a white paper or case study.
At the same time, it could contain a link back to the blog. By doing this, you’ve not only got a new piece of content but provided a backlink to an older piece too.
How to Create Infographics for Marketing
As you can see, infographic marketing is especially powerful when done right. And that’s the key part – your infographic quality has to be spot on. You can gain inspiration for your marketing designs with these marketing templates and student examples as a starting point. After that, we’ve created a simple 9-step guide to follow on how to create infographic marketing.
Step 1 – Choose the Right Topic
Before opening an infographic tool you need to have a clear topic for your infographic. Infographics need to be specific and not just a random collection of data. Examples of infographic topics could include:
Annual business figures.
New product promotion.
Business timeline.
Industry stats.
Expert advice.
Step-by-step instructions of a process.
A breakdown summary of a larger subject.
Statistical analysis.
Comparisons.
The topic should relate to your business in some way and also contain something that you can market or create a CTA from (Call to Action).
Step 2 – Draft an Outline
With a topic chosen, it’s time to create a rough outline of the infographic. This can be done in a Word document or simply by scribbling some notes and sketches on a notepad.
The outline can be as detailed as you want, but it should aim to do the following:
State the infographic’s goal.
The CTA you want it to include.
Identify the key data points and stats you want to visualize.
General ideas for headings and content.
A rough layout plan.
With this info, you should start to see an idea forming and be able to translate this into something tangible in the next steps. The outline could also include the infographic template you intend to use (We discuss the different template types later).
Step 3 – Gather Supporting Data, Statistics, and Info
The best infographic marketing is backed by statistics, data, and research. Instead of simply writing paragraphs, try to obtain statistical information, quotes, and figures that you can incorporate into the text. It’s worth diving into industry research reports, analyzing your company’s internal data, and keeping an eye out for compelling stats shared at conferences or in webinars.
These add weight and authority to what you are saying and help improve your credibility. Stats and figures also help convey messages more easily and place emphasis on important parts of your infographics.
This could be supporting evidence from your business and industry, or external sources that you find via online research. If you use data from reputable sources, you could include their logo as part of the content to boost the credibility of your infographic.

When adding data, think about which format fits naturally with the flow of the infographic and text. For example, sometimes a simple percentage or figure could be sufficient. In contrast, when showing comparisons, more detailed data, or changes over time, perhaps a graph or pie chart would be better.
It’s important to state where any stats and figures were taken from too in the footnote of your infographics to give credit, and so customers can do further reading if they want.
Step 4 – Write a Concise Copy
Now that you have a topic, a content outline, and supporting information, it’s time to create the infographic copy.
The text should be concise and with no fluff – every word should matter and add value. This comes more naturally when you write for the layout, as opposed to simply writing a block of detached text. Make sure to use plenty of headings where appropriate, and keep paragraph sizes small (ideally 1-2 sentences per paragraph).
For now, simply write the copy as a single piece of text. You may then have to chop and change it once you create the infographic layout in step 5.
Step 5 – Design a Visually Appealing Layout
You’ve got everything you need to start designing the layout for your marketing infographic. Unless you are incredibly creative or have a lot of time on your hands, I suggest starting with a premade template and editing it.
Platforms like Piktochart have thousands of professionally designed templates that you can use as a starting point for your infographic. You can usually edit every aspect of the template including colors, fonts, text, and image elements.

When creating an infographic layout, this simple 6-step process works brilliantly:
Strip away the template text and headings.
Fit my infographic copy logically into the different sections.
Adjust the elements and layout if needed.
Change the fonts to match the branding.
Change the color scheme to match the branding.
Look at any images and icons used and change them if needed (For example, are there any decorative images that don’t enhance the content?)
Don’t start messing with the colors and images first – This can get messy and it’s much easier to start by removing the template text and making sure your copy fits properly into the infographic layout.
Once the text and headings are sorted, you can start fiddling with the creative elements. You may also notice new opportunities where text could be replaced with images to improve the visual appeal.
Step 6 – Incorporate Your Branding
An infographic is a key opportunity to enhance your brand awareness and this is done by incorporating your brand color scheme, logo, and typeface.
Think of an infographic as an extension of your website or an additional web page. It should look and feel the same to promote a consistent brand identity across all your marketing channels. For example, HubSpot manages to create a cohesive blog via the use of infographics and images that subtly use their orange color scheme and similar fonts.
Step 7 – Add Interactive Elements
Infographics don’t just have to be static images and text – they can contain interactive elements too. If applicable, you could consider adding these to your content to improve user engagement. Examples include:
Animations.
Audio clips.
- Video.
Hover-over buttons.
Built-in quizzes.
It’s important not to add interactivity just for the sake of it. Interactive elements must always provide value and fit within the context of the infographic. If you can’t think of a valid reason to add interactivity to your content, don’t do it.
Step 8 – Optimize for Search Engines
Infographic marketing is great for SEO and there are several things you should do including:
Keywords in headings and paragraph content.
An Alt Tag for the infographic that describes its content.
Internal links on relevant elements within the infographic.
Compressed where possible to reduce image size.
Including a text-based version of the infographic content for search engines to crawl.
If you have a keyword strategy, consider including primary and secondary keywords in the infographic in the headings and strategically throughout the content (but don’t spam them!).
When used on a web page, your infographics must also have alt tags. These are alternative descriptions that are used for visually impaired people. Search engines also use alt tags for context and categorization so they serve a dual accessibility/SEO purpose. Your web development platform or eCommerce store should have the option to add alt tags.
Platforms like Piktochart allow you to add links to infographic elements like headers and images. Consider adding internal links to relevant web pages, and external links to high-authority sites as these are both factors Google looks at for SEO.
Lastly, make sure the image is compressed without losing quality. Tinypng is the best online tool to use as this allows you to compress images for web use.
Step 9 – Incorporate Embedding Features and Social Share Buttons
You want your marketing infographics to be sharable so adding embed code and social share buttons is essential.
Embed Code – This is HTML code that a user can copy and paste to embed (place) the infographic in a piece of their content such as a web page. Some infographic tools have this feature but there are free embed code generators too.
Social Share Buttons – These are custom buttons with a link that allows a user to share the infographic on a social media platform of their choice. There are share link generators you can use to create the links – these can then be added as clickable buttons on your infographics, or the code can be embedded beneath the infographic on the web page it’s posted on.
Best Practices for Effective Infographic Marketing
Not all brand infographics work and you can find that this is often due to simple things being ignored, or basic design principles being misunderstood. To help you avoid these issues and start designing eye-catching infographics that yield real results you can find 9 best practices below.
Use the Right Infographic Template
The first step is to make sure you use the right template or structure for your content. Think about what you want to convey via your infographic and if a specific template would work. Here are six versatile templates that work for most content:
Comparison: A comparison layout is ideal if you have an X vs Y scenario. These infographics are typically in a vertical format with X features on the left, and Y features on the right. They allow the user to see the differences between the two objects easily.
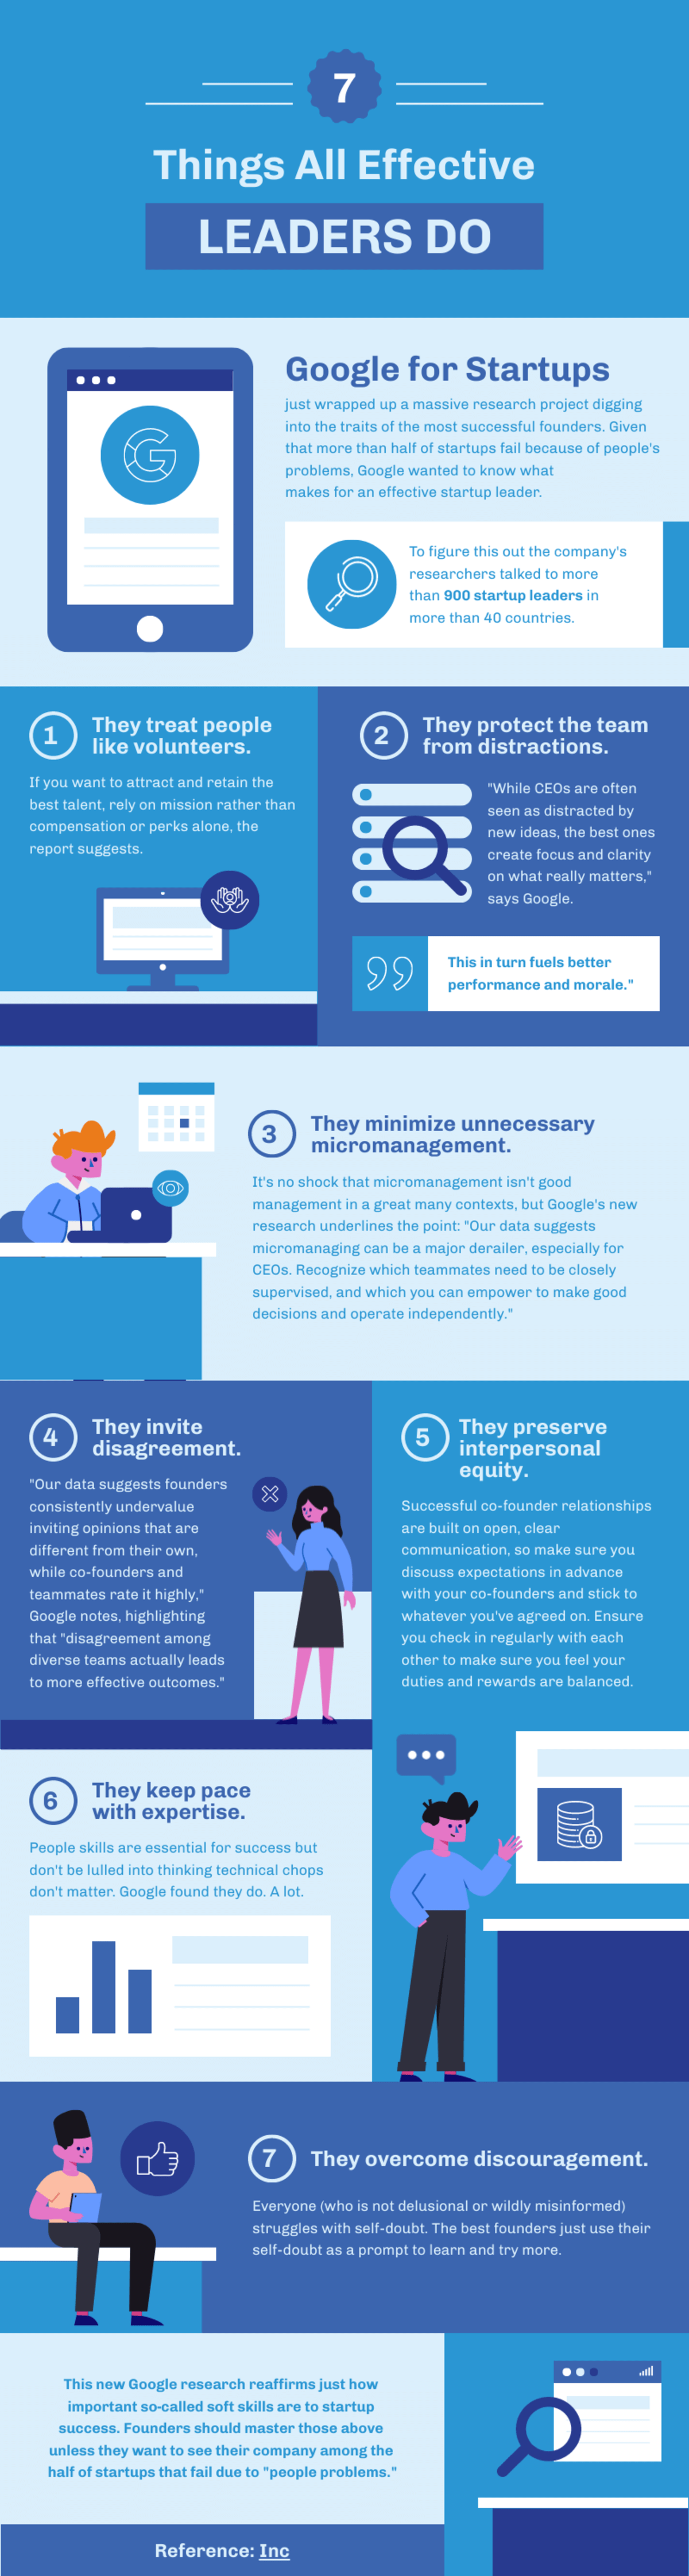
Useful bait: These could be considered the “generic” templates – ones that are suitable for multiple scenarios. They are easy to read, practical, and break down the topic into small, digestible blocks.
Heavy data: Heavy data templates are great for reporting and content with lots of statistics. They allow you to present the info in a structured manner with clear imagery such as bar charts, pie charts, and percentage markers.
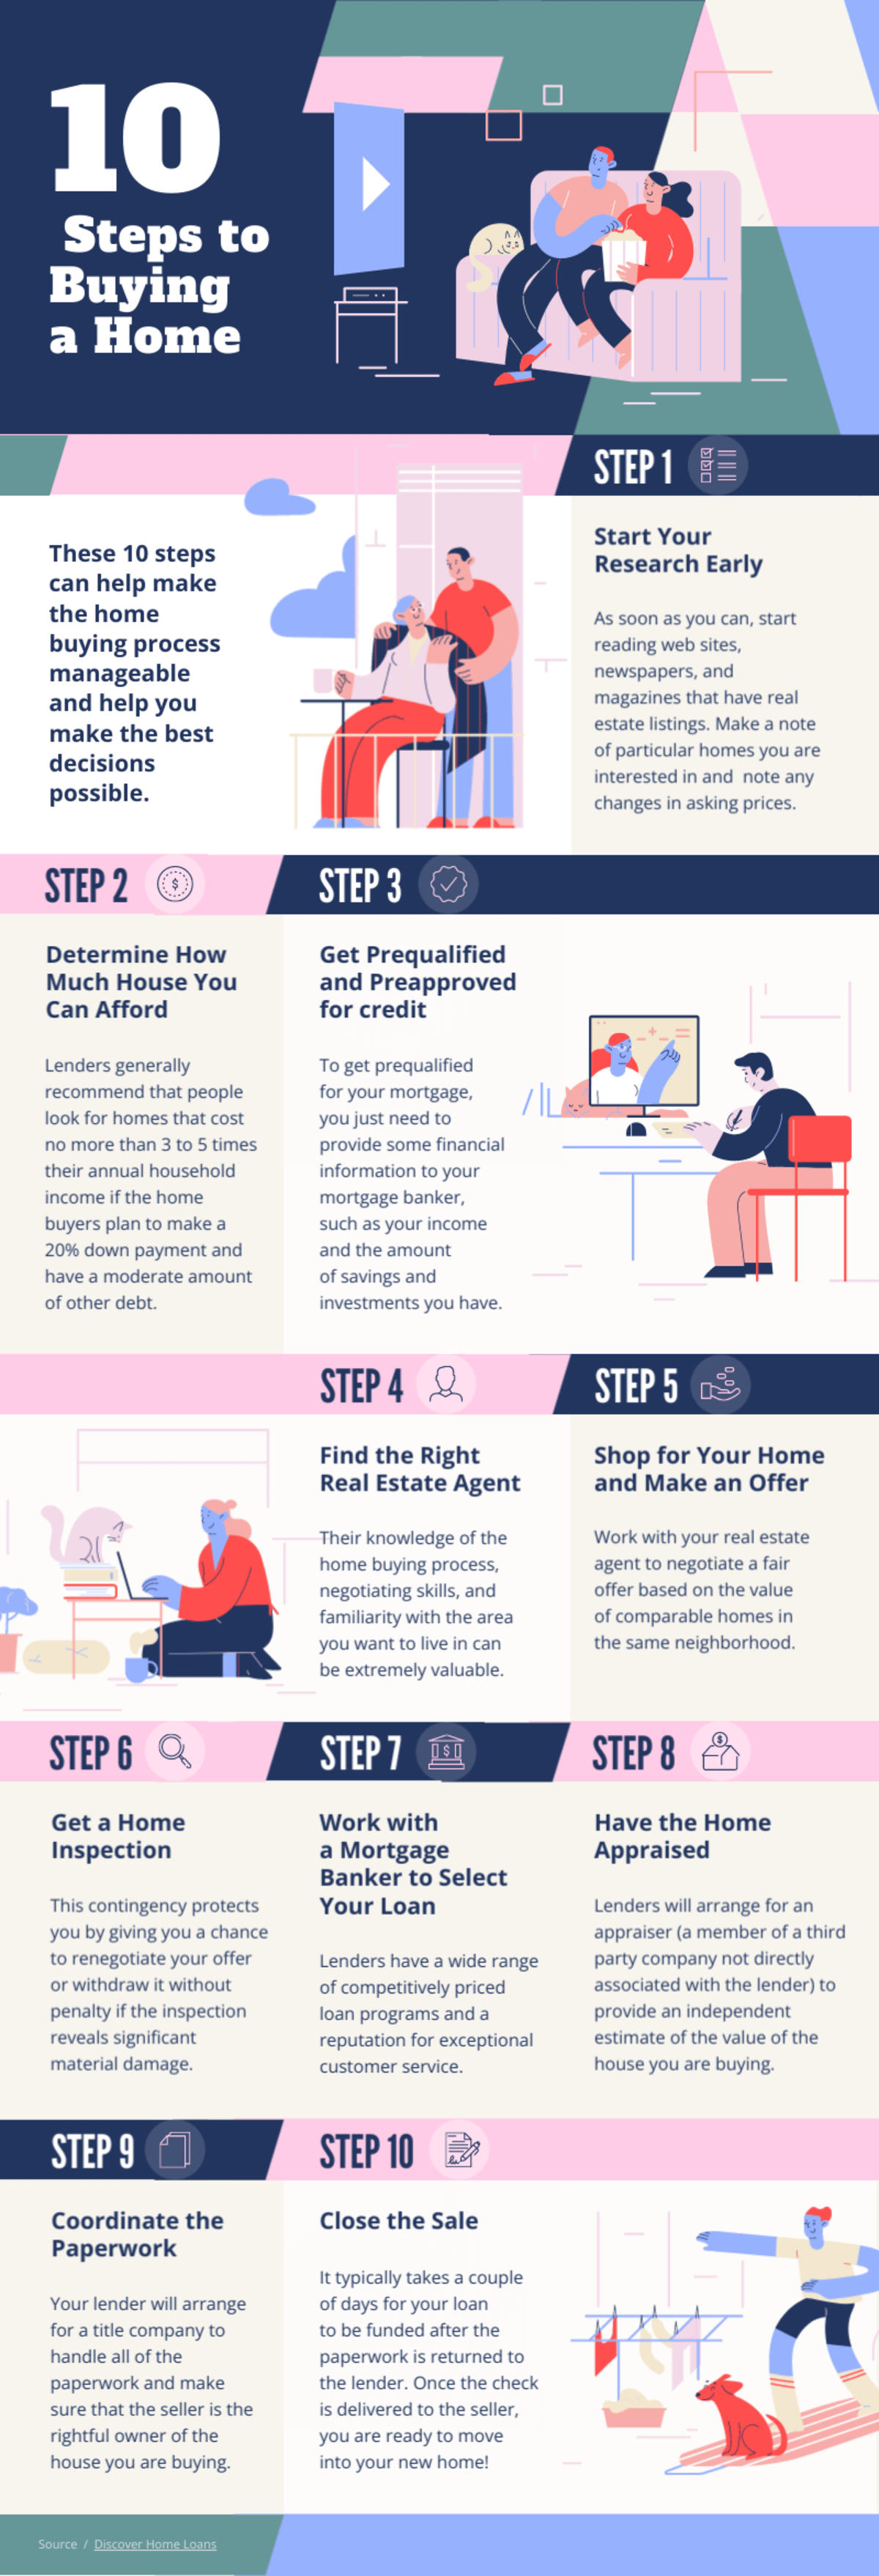
Road map: If you want to explain a process the road map layout is perfect. Examples can include using a product, a cooking recipe, or the expected schedule of an event. The map has a clear start and end point, with the in-between steps being linked in a satisfying visual way.
Timeline: Anytime you want to explain something chronologically, a timeline template is the top choice. This could be a timeline of your company history or the timeline of a new product development for example. The template is broken into clear milestones with each one having a specific time/date marker.
Visualized article: These templates place an emphasis on visual elements and use images to help convey your content. Text is included, but it is usually minimal and interspersed with a heap of complementary media.
The Content Must be Accurate and Well-Researched
Infographic content marketing must have real value and be useful to the reader. For example, perhaps they can learn something new, understand a process, or learn how a product works.
Make sure every piece of text adds something to the infographic – if you can still understand the infographic’s content without that piece of text, why is it there?
Accuracy and detail are also imperative – anything you say in the infographic must be true! You can add detail to your infographics by including stats, quotes, and facts too.
Make Sure the Layout has a Logical Flow
Ideally, marketing infographics should have a logical flow and read from top to bottom. This example from Chairoffice.co.uk demonstrates it perfectly. The infographic starts with a heading at the top, and then describes a numbered list of world records – it’s easy to follow and flows nicely.
Readers shouldn’t have to keep jumping back and forth between sections or need a degree to figure out how to digest the content. This makes the infographic difficult and frustrating to read and will reduce its effectiveness.
Plan the content flow with clear section blocks and use a numbered order if necessary to help create a logical layout. You can also use arrows, lines, or other directional elements to connect pieces of the infographic in the sequence you want them consumed. Here’s an example of an infographic with a logical and easy-to-follow flow.
Once you’ve created the infographic, go back and read it multiple times. Can you easily follow the content? Did you find you had to skip back to different sections? If you notice any issues, take a look at the layout again and see where it can be improved.
Manage the White Space Effectively
White space is the empty areas surrounding text and images in your infographics (Sidenote – It doesn’t just apply to the color white and means any open space surrounding elements). If you look at these infographic examples, you will notice that the white space is managed efficiently and contributes to the flow of the content.
Effective white space distribution can:
Improve readability by allowing users to easily focus on content sections.
Improve comprehension by guiding the reader’s eyes.
Creates visual breathing room and prevents the design from feeling overwhelming.
Helps establish groupings of related content.
The central and symmetrical alignment of elements helps with white space management. Giving enough space between headings, paragraphs, and other items is essential too. Make sure that there aren’t huge areas of white space too as this can make the infographic feel incomplete.
The Typeface Must be Legible
Using stylish fonts is appealing, but the first rule of typeface utility is readability. There is no point using a fancy font such as “Lovers Quarrel” if your readers have to squint to read it.
Instead, look for fun and catchy fonts that are also easy to read. Fonts I enjoy include Pacifico, Cabin Sketch, Adventure, Lobster, and Loved by the King. These all look fantastic but are incredibly easy to understand and will still make your infographics shine.
Don’t Forget Search Engine Optimization
SEO doesn’t only apply to website pages. It is relevant for infographics too so don’t forget the basics.
Make sure your infographic has an Alt Tag (An Alt Tag is an alternative description for an image and is used for screen readers, etc.) that describes the content.
Include primary and secondary keywords within the infographic headings and content too. Make sure the keywords are relevant to the infographic subject and fit logically within the flow of the text. Simple inclusions like this can contribute to your overall SEO strategy.
Promote Your Infographics on Multiple Channels
Your website isn’t the only location to promote your infographics.
Doing this is fine, but go one step further and utilize your infographics on as many channels as possible including social media and email lists.
Simply put, more promotion means more views which translates to more clicks and exposure.
Track the Performance of Your Infographics
To make continual improvements to your infographic content marketing you must track performance. This can be done in the following ways:
Landing page metrics.
Social share counters.
Reverse image search on Google.
Backlinks.
If your infographic links to a landing page or specific web page you can track the traffic that is directed to that page using tools like Google Analytics, Moz, or SEMRush. This shows if your infographic is making an impression and resulting in conversions.
Adding social share counters to your infographics is an easy visual indicator of its performance. The more it’s shared, the more effective it is and the more people are seeing it.
Performing a reverse image search on Google Images allows you to see if your infographic has been referenced or used elsewhere. This is primarily great to see if people are talking about it, but also to stop plagiarism!
Checking the backlinks that have resulted from your infographic is useful too as backlinks are an integral component of SEO marketing. Tools like Moz Open Site Explorer allow backlink tracking.
Google also has its Alerts system where you can create alerts for mentions of target keywords and the infographic title. This helps show other instances of your Infographic being shared outside of image embeds.
Examples of Successful Marketing Infographics
For further inspiration, I like to look at what other companies are doing and how they’ve successfully used infographic content marketing. Below, I’ve hand-picked five of my favorite examples of infographics that I think show how powerful they can be.
1. Thoughtworks.com – 100 Years of Computer Science
I love the simplicity of this computer science infographic. It uses a timeline template and the emphasis is placed on the photos, text, and time markers by the use of a white background and stylized photos. The data is aimed at students studying computer science. A simple but effective element of the content is that each piece of text links to the relevant paper or a discussion about it so the student can learn more.
2. LinkedIn – The Most Inspired Sales Professionals in the World
This statistical infographic works on several levels but I instantly like the restrained color palette that uses a combo of blues and greys – it helps keep the infographic consistent. The use of icons and imagery for the statistics works brilliantly too such as the skyscrapers showing inspiration by company size.
I like that while this article seems generic, LinkedIn adds a CTA and promotion for its platform at the end too showing how people can gain inspiration from using it.
3. United Nations – Sustainable Development Goals Report
This infographic from the UN shows how bold headings and a simple color scheme can make an impact. I’m immediately drawn to the different sections and the words colored red and the infographic effectively show the impact poverty is having around the world.
4. TD Insights – How Bad Data Affects Business
TD Insights has produced a fantastic informative infographic that gives a clear summary of bad data. It starts with the impact and backs this up with stats and goes on to explain how to identify the issue. You then get advice on how to avoid bad data and the reasons it occurs. I like that throughout the infographic icons, images, and stats are used, and the bold orange color matches their brand and places emphasis on important information.
Tools and Templates for Creating Infographics
To create inspiring business infographics or marketing infographics, you don’t have to use a complex program like Adobe Photoshop. Instead, there is a fantastic range of tools, templates, and resources that make the design and creation process easy. With the right resources, anyone can create professional-caliber infographics, even without formal design training.
4 Fantastic Infographic Marketing Tools
You are spoilt for choice when it comes to infographic marketing tools. There is a heap of platforms that provide drag-and-drop editors and hundreds of stylish templates so anyone can create an infographic without design experience and these are my top picks:
Piktochart: A powerful infographic design tool that enables you to create an infographic simply by typing an AI prompt. It also has a vast array of professional templates and the drag-and-drop editor is easy to use.
Canva: A creative design platform that allows you to produce infographics, website images, social media content, and more. There is a basic free version available while the premium subscription unlocks more templates and features.
Adobe Express: A creative design suite that works as a watered-down more accessible version of Photoshop. It has an infographic design tool within the editor that allows you to draw from Adobe’s vast catalog of stock images.
Visme: A popular free infographic maker that uses AI enhancements to make the design process simpler. The drag-and-drop editor gives complete control and allows you to easily insert images, icons, and more.
Further Reading to Improve Your Infographic Marketing Knowledge
I get that it can be difficult to create infographic marketing content so to give you inspiration I’ve produced a list of useful resources below:
99firms – Useful stats relating to infographic and image use
Dribble.com – Inspiration for infographic designs
CreativeBloq – Infographic inspiration
Reallygooddesigns.com – Creative infographic examples
Semrush – 41 Infographic Examples & Explanations
Piktochart – Advertising Infographics on Pinterest
Conclusion
As you can see, a well-designed infographic works as a powerful marketing tool. Infographic marketing is incredibly potent when done right and this starts with nailing the topic, copy, and layout. Start by creating an original idea that you can incorporate a CTA into, write compelling, engaging, and accurate copy, and mold that into an eye-catching but technically sound infographic template.
After testing a range of infographic editors I’ve found that this and more can all be done using Piktochart. It has a huge template library and an easy-to-use drag-and-drop editor. The platform is also packed full of graphics, icons, fonts, and stock photos, plus you can easily incorporate your branding including color palettes and logos.
If you want to start producing high-quality infographics for your marketing, why not register an account and sign up for Piktochart?