This post is part of our guide to using infographics in education. For more information, check out the guide here.
The importance of infographics in literacy education is essential. Literacy is more than just reading and writing. Literate people can infer meaning, communicate with others, and capture ideas in many different ways. With infographics, I hope that educators can broaden our students’ visual literacy.
Visual literacy is the unique structure and practice of conveying and enhancing information through primarily pictorial representations, according to Donis A. Dondis, author of A Primer of Visual Literacy.
Infographics play a key role in visual literacy. An infographic is a visualization that uses words and pictures to make a point or tell a story. In simpler terms, it’s known today as visual storytelling.
Through graphs, charts, and tables, the creator exhibits evidence for analysis, and the analysis process can lead to deeper thinking and richer engagement. That’s the goal, right?
Business analysts, marketing groups, and journalists frequently use infographics because they are dynamic visualizations that present complex or sizable information in a digestible format:
Infographics are being used more frequently and in more places, like news broadcasting, social media, and advertising. You could also make one within minutes by signing in on Piktochart and customizing a template of your choice.
In education, infographics often appear in textbooks and handouts as static text features or graphic organizers. Although they support the material being presented, teachers don’t always seize the opportunities to analyze them in search of deeper learning.
[irp posts=”14617″ name=”3 Tips for Easy and Engaging Classroom Visuals”]
Educators are supposed to teach students how to analyze the messages being relayed by many types of media, and infographics can be remarkably useful in these scenarios. Likewise, infographics require skills for decoding the language of imagery. If a student has frequent encounters with infographics in education, he or she will learn an essential skill that can help lead to more success in the future.
Why Visual Literacy Matters
Research has shown us that visual learners build deeper knowledge through visual learning. Infographics represent an evolution of literacy, where infographics serve as an essential language of literate readers and writers.
Most of all, infographics can motivate readers who are typically more reluctant to engage with dense passages of information.
When students are asked to create products that show their learning, they have a powerful medium in infographics. The creator’s purpose, genre of writing, and grammar are abundantly displayed in both the written text and the illustrated text. Multiple perspectives are encouraged, and the variety of mediums used to present information (text, charts, icons, etc.) allow for frequent and varied analysis.
I often compare infographics to outstanding presentations or writing. The best visuals are about quality of design, not the quantity of elements. It’s easy to get excited about colorful graphics or iconography, but the message should still be clear and powerful.
Effective authors deliver a powerful story, but let the reader’s imagination take flight. Most infographics can be deceiving: at face value, they appear simple; then they build more complexity as needed. Like the writing process, a solid outline evolves into a better draft that we continue to polish into a complete essay.
Infographics can offer aspects similar to that of a complex text by using multiple images, words, and graphs while continuing to convey a clear message. Strategically, this is similar to the process of close reading. Close reading encourages deeper learning.
The U.S. Common Core State Standards (CCSS) represented a shift towards greater text complexity and close reading. The design features of infographics are critical in the CCSS. For instance, the language of Reading Informational text, Standard 7 includes the integration of “information presented in different media or formats (e.g. visually, quantitatively) as well as in words to develop a coherent understanding of a topic or issue.”
Due to the emphasis on the cross-curriculum embedding of literacy skills, educators are more likely to be expected to provide instruction in infographic literacy.
Best Practices
One great way to educate using infographics is to discuss and create infographics in the classroom. Educators use class time to draft papers, read texts, and deliver presentations. Infographics allow you to do all of these tasks in an engaging and dynamic fashion.
With Piktochart Pro, you can customize your own template, upload your own fonts and collaborate with upto 24 team members! Get started for free by creating an account. Upgrade at a discounted price for education!
I start my students with an examination of infographic examples found online and in print. We take time to annotate them as a whole group, and then I ask them to collect and annotate one that captivated them. A simple web search allows students to find topics and styles easily.
When analyzing the infographics, I ask students to answer and annotate evidence of the following:
- What is the focus of the infographic?
- What is the author’s purpose?
- How does the author demonstrate authority or knowledge of the subject?
- How do the visual elements support understanding or analysis?
- If you could improve this infographic, what might you illustrate differently?
The next step is to create a working list of their findings. Modeling this practice provides visible evidence that is co-constructed by the teacher and the students. By creating a t-chart on the board as shown below, or in a shared document, educators can break down the complex messages of infographics.
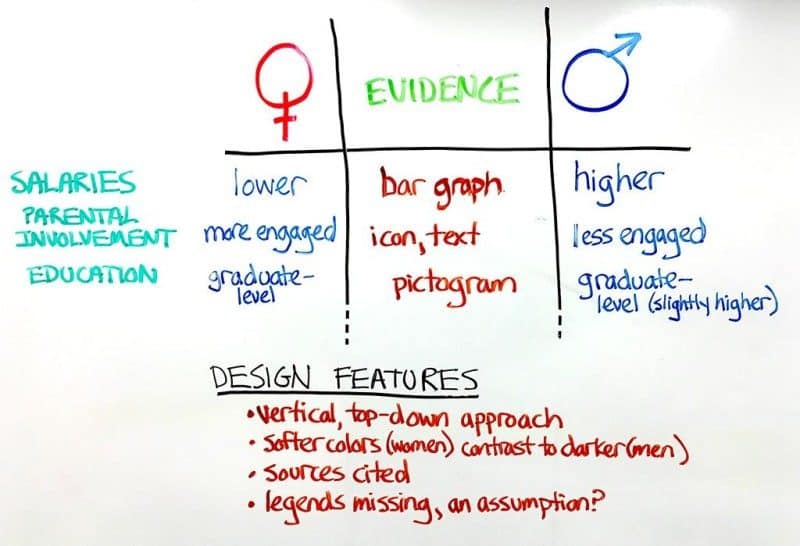
For some advanced students, distractors will be more obvious and similarities may become clearer. Struggling students may need more time to examine infographics with the aid of other resources such as a color meaning or common symbols tables. By working together on different task that help to achieve a greater goal, the classroom becomes a microcosm of the publishing world. The dialogue between the students reveals perspectives and ideas that are as diverse as the designs.
When they are ready, students can select a topic around which they can design an infographic. This is a challenging task, like writing a formal paper or analyzing a complex written work. Encourage your students to sketch ideas and borrow cited samples in the early stages.
As they revise, each student should reflect on his or her changes through a journal. Using this journal and the many versions of the finish product, teachers can evaluate the effectiveness of author’s purpose, knowledge of the subject, quality of visual evidence, and concise delivery of the message.
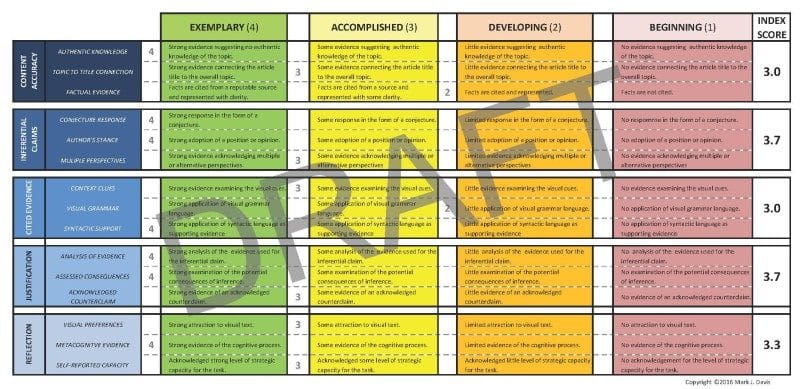
I have included a suggested rubric for high school students that I am still piloting:
Using social media, students can post their exhibits, allowing their peers to reflect in another t-chart or comments section. Piktochart is an outstanding tool for this task given the abundance of infographic examples and templates for students to focus on the message rather than the display.
Into The Future
Educators using infographics will remain ahead of the curve when it comes to teaching practices and techniques. The interfaces of our technology are expanding visually, and we need to use these techniques for improving instruction. Graphic designers and artists have a vast knowledge of illustration, but incorporating complex infographics in the pre-kindergarten to 12th grade curriculum will help all learners grow.
Today’s readers are exposed to new literacies through hyperlinking and multimedia. Infographics will enhance our understanding of complex data and illustrates narratives in a dynamic fashion. We may not all be great designers, but we can be exceptionally literate learners.
Get started with infographics in education by signing up for free on Piktochart. Upgrade at special price for education!
This post is part of our guide to using infographics in education. For more information, check out the guide here.
Create presentations, reports, infographics, and more.
Sign up for free. Upgrade later.
Create a visual