Creating a sales report that is readable, digestible, and appealing is now easier than ever. Today, you can prepare your report in a fraction of the normal time and with less stress.
A sales report template makes this possible.
With sales report templates, you create reports that capture your audience’s attention and drive home your message more effectively.
In this guide, we’ll break down the 10 essential sales report templates every team needs. To access a library of free, proven templates, sign up for Piktochart now.
What is a Sales Report?
A sales report is a document that highlights a company’s sales performance over a determined period. It shows a clear picture of the sales trajectory of a company. Sale reports could be daily, weekly, monthly, quarterly, and annual. The main aim of a sales report is to measure the organization’s sales growth and take necessary actions.
Knowing how to write a sales report is one of the top skills a sales rep, supervisor, or manager must possess. Doing this effectively involves collating the right data and leveraging report templates.
Report templates provide a ready-made framework that makes it easy to organize and analyze data systematically. These templates help to ensure your data presentation is consistent and captivating.
Templates are easy to use. Simply have your data ready, then browse through templates to choose the one that best suits your presentation and customize it.
Building your own report from scratch is also easy. Without design experience, you can craft stunning, professional reports, using our AI report maker. With just a few steps, your report will be ready to use.
Essential Elements of an Effective Sales Report
Common mistakes people make when creating sales reports include adding too much text and using insufficient visuals. To stay clear of these mistakes, ensure your report contains the essential elements of an effective sales report.
- Sales KPIs and metrics: The main reason you’re writing a sales report is to bring your team or superiors up to speed on the sales performance of the company. Therefore, Key Performance Indicators (KPIs) and metrics like sales revenue, average deal size, and profit margin should take the front seat in your report.
- Timeframes: Timeframes are essential features in any sales report as they enable tracking of sales performance over a set period. Breaking sales information into timeframes also helps simplify complex data.
- Comparison columns: This element is great for performance evaluation. It compares data sets so that your audience can identify trends and patterns, do a more effective assessment, and make better decisions.
- Visualizations: Visualization features like charts and graphs make raw data digestible and engaging. Reports with visuals make trends and patterns easily identifiable, enabling a smoother decision-making process.
- Customizable fields: Make your report easily customizable and adaptable to accommodate changes in data. This flexibility leads to a more relevant, actionable, and insightful report.
5 Types of Sales Reports to Create Using Templates
There are five types of sales reports – daily, weekly, monthly, quarterly, and annual. Note that the metrics under each report type overlap. Therefore, use your discretion to add the ones you consider relevant to your report.
1. Daily Sales Report
Daily sales reports are perfect for keeping reps and managers aligned on real-time results. Account executives can use them to monitor quota attainment. Likewise, leaders can coach outliers right away rather than waiting for problems to compound.
The following metrics are typically found in a daily sales report:
- Total daily sales revenue: Stakeholders are kept abreast of the company’s financial health on a day-to-day basis by the total daily sales revenue metric. This daily update gives immediate feedback to the team and promotes real-time adjustments.
- Units sold: Tracking units of products sold daily lets the sales team know the market demand, marketing and sales campaign effectiveness, and product popularity.
- Sales by product/service: This metric breaks down the total sales figure, revealing each product’s sales performance. With this, your team can identify best-selling products and make strategic decisions accordingly.
- Average sale value: ASV is the average amount of money spent by customers in a single transaction. To derive this, divide the total sales revenue by the number of sales transactions in a determined period. A high ASV shows that customers are purchasing more items per transaction. Knowing the average sale value enables the team to measure the effectiveness of sales strategies.
- Profit margin: Let your daily report show your company’s profit margin. This metric is especially useful if your company is into eCommerce. Knowing the profit margin of each Stock Keeping Unit (SKU) every day will reveal the most profitable ones, guiding stakeholders in making strategic decisions.
- Refunds and returns: When stakeholders know the amount of refunds and number of returns in the day under review, they get data and actionable insights on product quality and customer service. These insights will, in turn, improve product offerings and boost customer experience.
- Inventory levels: With this metric, your readers know the current level of stock. This information helps in inventory management and restocking predictions.
Check out this template. It is perfect for a daily sales report. It has a daily progress report chart to monitor goal completion and another one that compares the day’s progress to the previous one. Simply input your prepared data to make it yours.

Customize this comprehensive and appealing landscape template for your daily report. It has the average sale value metric that lets you know the average amount of money spent by customers in a single transaction. Other metrics you’ll find interesting are leads generated and lead-to-sale conversion.
2. Weekly Sales Report
For sales managers, weekly rollups are vital for keeping the team on track. You might not need a daily report, in which case reviewing core metrics together on a weekly basis can surface learning opportunities, as well as foster accountability. These reports also guide 1:1 check-ins to ensure deals are progressing.
Here is a breakdown of essential weekly metrics to include in your weekly report.
- Total weekly sales revenue: Putting your total sales revenue in your weekly report is putting the right foot in the right direction. This metric lets your team know if the company is meeting the desired financial goals or not.
- Weekly sales volume: When you present this in your report, you reveal the number of products sold in a week to your audience. This information will then serve as a guide for the team to track their performance against set targets.
- Product performance: Data on how products perform in the week boosts strategic focus, product innovation, and market positioning. For example, if you have two products and one is doing much better than the other, this metric lets the team decide whether to focus more on the poorly performing one to give it a boost.
- Sales by channel: Team members want to know which sales channels are doing well and which aren’t. This section analyzes sales across different channels, helping the team to identify the most effective ones and allocate resources efficiently.
- Customer feedback: Your report becomes more valuable when you add the customer feedback metric. It opens your readers’ eyes to customer preferences and expectations. This feedback lets the team identify areas of improvement and take the necessary actions.
- Revenue forecast: Based on the data you’ve shared, you can now forecast revenue for the coming week. You have an idea of the revenue to expect. Having this metric in your report shows you’ve done your homework. Revenue forecast promotes strategic planning and operational efficiency.
Package your weekly sales summary into this colorful template. It has customer feedback and revenue forecast metrics. The well-designed sections can comfortably house your data on sales revenue, sales by channel, and other components of your report.

Here’s another template you can customize for your weekly sales report. It has graphs and charts to make your raw data digestible and engaging. The columns can also sufficiently accommodate as many segments as you may have. Don’t forget to add your company’s brand elements.
3. Monthly Sales Report
Monthly reports provide detailed insights into sales performance and strategies. Teams can quickly spot shifts in sales trends, take commensurate actions, and make accurate revenue forecasts every month.
Consider including these metrics in your monthly sales report:
- Total monthly sales revenue: Also known as monthly sales value, this metric reflects the financial health and market positioning of your company. Including it in your report guides the team to plan more strategically and set relevant goals.
- Monthly sales volume: Keep your audience abreast of market demand and product popularity with this metric. Having it in your report helps your audience assess the effectiveness of sales initiatives and set realistic targets.
- Month-over-month sales review: Monthly tracking of sales performance not only enlightens the team on market changes and the effects of sales campaigns; it also promotes agility and better resource management. For example, if your company just launched a new product and this metric shows a decrease in sales volume over months, strategic adjustments will be made to boost sales.
- Average order value: Letting your team know the average amount spent per transaction provides insights that lead to better-tailored strategies, pricing adjustments where necessary, and product optimization. To calculate your AOV, divide your total revenue by the number of orders you get over a specified period.
- Conversion rate: The conversion rate deserves a spot in your monthly report as it measures the effectiveness of the sales and marketing strategies.
- Sales by product line: A monthly review of top-performing products and poorly performing ones enables the team to allocate resources more efficiently. It also promotes an in-depth understanding of market demands and customer preferences.
- Sales rep performance: If you’re reporting to other sales managers or supervisors, let your report highlight the performance of sales representatives. But don’t forget to show the criteria used for the evaluation, e.g. deals closed, revenue generated, and customer satisfaction.
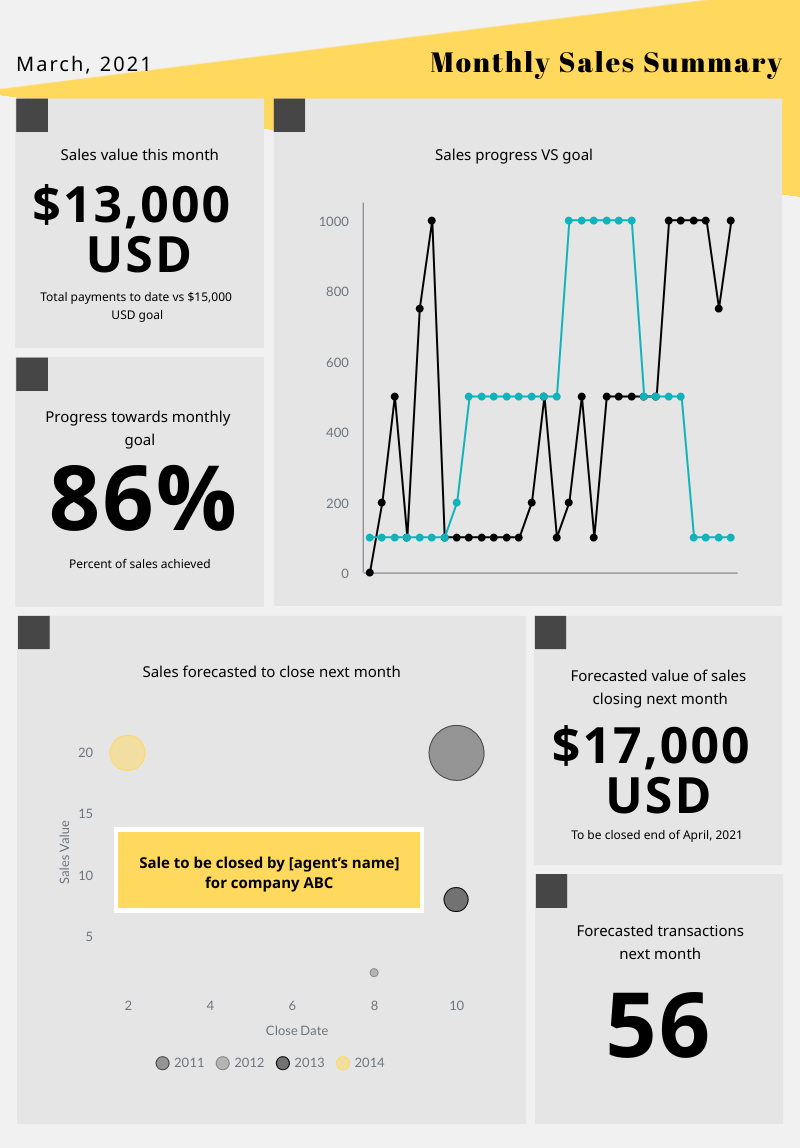
Turn your data into clear visuals with this template. It has useful fields for monthly sales value, progress toward monthly goals, sales progress vs goals, and sales forecast. Simply move the elements around and edit as you deem fit.
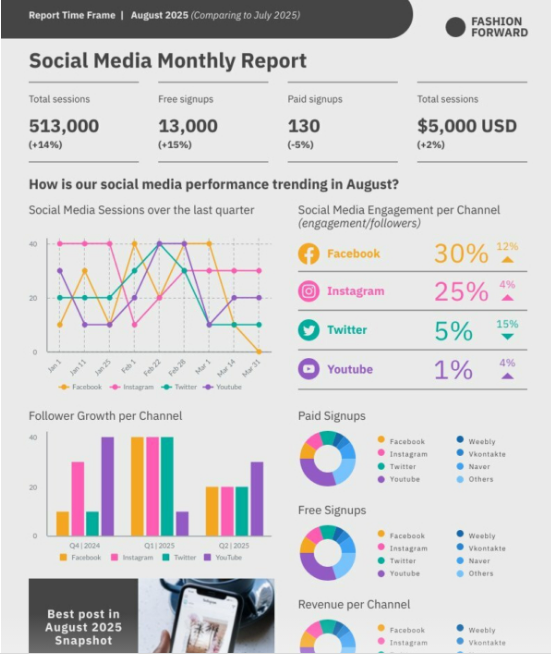
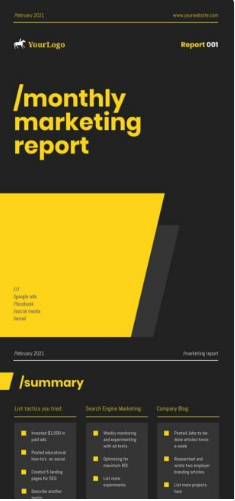
Try this template if you want a colorful, well-laid-out report. There’s a segment that allows you to list the tactics used in the month and measure their effectiveness. The template also has graphs and charts that help you convert your hard data to visuals for improved readability.
4. Quarterly Sales Report
A quarterly report offers a comprehensive overview that is essential for strategic planning and decision-making. This report empowers the team to identify patterns, periodical impacts, and market shifts. Armed with these insights, management can make impactful decisions on product optimization, resource allocation, and market expansion.
Here are key metrics that should be in a quarterly report:
- Total quarterly sales revenue: This is the financial outcome of your team’s efforts in a quarter. It is a snapshot of their performance and is necessary for strategy assessment and making the right adjustments.
- Quarter-over-quarter sales review: With this metric, management is able to measure growth patterns across quarters. Comparing sales in the quarter under review with previous ones provides valuable insights into the effectiveness of sales strategies.
- Average order value: You give your readers data and insights into customer spending behavior when you add the average order value to your report. This information will enable the team to employ strategies that will encourage higher spending.
- Customer acquisition cost: Let your readers know how much it costs to acquire a customer. This data lets them know how efficient and sustainable the company’s sales and marketing strategies are.
- New vs returning customers: Every sales team should know the effectiveness of their retention strategies per quarter. Including this in your report will help the team work towards creating a balance of new and returning customers.
- Market trends and competitive analysis: Monitoring marketing trends and analyzing competition equips your team to see new growth opportunities and refine its value proposition.
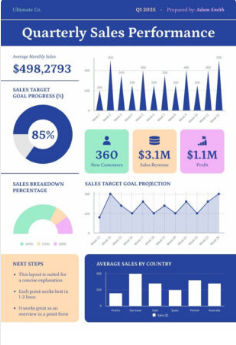
This template has just the elements needed for your next quarterly report. Apart from slots to insert your name and other basic details of your report, it has segments for average quarterly sales, sales target goal progress, sales revenue in percentage, profit, and other important features of a quarterly sales report.
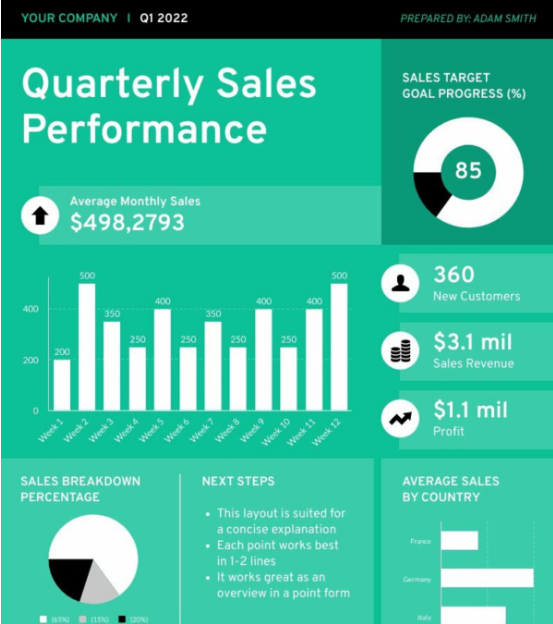
Have a look at this template also. It has segments like new customers, sales revenue, and profit. The graphs and charts can be used to show trends and illustrate data in percentages.
5. Annual Sales Report
This report is a year’s worth of sales data that offers strategic insights into long-term sales patterns and the company’s financial health. When put together professionally, it helps the team to gauge growth, identify challenges, and plan strategically.
In addition to other basic metrics earlier discussed, include these in your annual sales report:
- Year-over-year sales review: A clear, comparative insight into yearly sales performance is one of the advantages of a year-over-year sales review. This metric lets the team know which sales and marketing initiatives have been effective in the long term.
- Market share analysis: Show in your report how your company stacks up against competitors in the market. It will make your audience identify rival threats and spot opportunities. This analysis will also equip the team to anticipate market trends and prepare accordingly.
- Strategic initiatives review: Your yearly report should show the effectiveness of strategies and tactics deployed in the course of the year. A systematic analysis of these outcomes will enlighten the team on areas to improve upon as well as success areas to build on.
- Sales goals for the next year: Including a segment in your report that states goals for the next year is a proactive move. It aids strategic planning and efficient resource allocation.
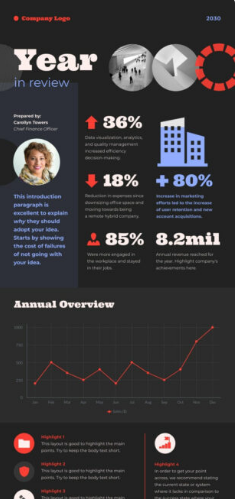
This is a winning template for compiling your yearly sales report. It has a graph for an annual overview of sales metrics and performance. There’s also a field to insert your picture if you like. This template is downloadable in PDF and PNG.
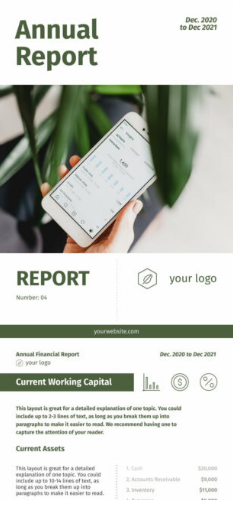
Prepare an impressive report with this template. It has graphs and charts to illustrate your points more succinctly. This template also has sufficient space to input your metrics and explain your data.
Benefits of Using Sales Report Templates
Sales report templates are valuable tools that improve clarity, efficiency, and sales growth. Understanding the numerous benefits of using these templates serves as a motivation to leverage them. Let’s look at some benefits of using report templates.
- Time-efficiency: When you customize a template for your sales report, you save time that would have been used to create a report from scratch.
- Easy sharing of key data: Templates provide a consistent format that makes it easy for your readers to quickly grasp key information. Also, your recipients soon become familiar with the template format, which reduces the need for extended explanations, speeding up the review process.
- Smooth tracking of sales metrics and KPIs: The pre-defined metrics found in templates guide you on what to track without having to think about it, making the process smooth and easy. Also, the consistency you achieve from using the same template format enables you to compare sales data over different timeframes.
- Sales performance comparisons: The uniformity in the presentation of data that templates offer makes it seamless to compare performance across board and over specified periods.
- Trends and insights for sales strategies: The consistency in data presentation found in templates helps the team to quickly spot trends. Also, templates enable the comparison of current sales performance with past ones, making it easy to identify trends, get insights, and develop strategies.
Tips for Customizing Sales Report Templates
- Start with a template but modify it to fit your needs: Templates are not supposed to tick all the boxes. They’re to give you a framework that makes your job easier. Therefore, when preparing your report, choose a template that mirrors what you’re looking for, and then customize it to suit your needs.
- Add branding elements like logos and color schemes: Templates are generic, so you need to own them by adding your company’s branding elements. These elements include your company’s logo, color schemes, and typography.
- Include benchmarks and goals specific to your business: You may have chosen the best template for your report, but you still need to include goals and specifications unique to your business and purpose. Before you start creating your report, outline the specific goals you want to achieve and tailor the template accordingly.
- Automate data population when possible: To save more time and reduce errors, automate data population when you can. When you leverage technology to automatically organize and input data in your report, you manage time more efficiently and produce an error-free document.
- Get feedback from sales reps on usefulness: Feedback is vital when preparing a sales report. It improves the quality of your presentation and saves you from making avoidable mistakes. Therefore, share your report with sales reps to get their perspectives and opinions on data, style, branding, and choice of template.
Tips for Customizing Report Templates
Best Practices for Sharing Sales Reports
Make your sales report more impactful by implementing practices that will enable you to share them more effectively. These practices include consistency, contextual analysis, and accessibility.
- Set a consistent reporting cadence: As a sales manager, have a regular and predictable schedule for sharing your sales reports and stick to it. This consistency helps you build a routine that facilitates strategic data review and decisions.
- Determine the right metrics for each audience: When sharing progress on sales performance, it’s tempting to stuff every possible data point into your report. But put yourself in your exec’s shoes. They’re drowning in data and pressed for time. To get their attention, curate only the most critical KPIs for their goals.
For example, a CEO may only need to see top-line revenue growth and forecasts. Your sales enablement leader, on the other hand, will want to dig into rep productivity metrics. Thinking carefully about what matters most to each stakeholder will boost the impact of your reports.
- Add context with insights and analysis: It’s easy to assume everyone understands the context of your research. That’s not usually the case. Your report can end up confusing your audience instead of enlightening them. Contextualizing your data and analysis gives your readers a better understanding and equips them to make informed decisions.
For example, if you’re tracking the sales of a new product, instead of just putting the figures, give the context around them like sales trends, customer feedback, and a comparative analysis. Putting these data in context is far more effective.
- Highlight successes and areas for improvement: Let your report give recognition where due and also guide the sales team on ways to improve performance. Incorporating these features will help you build a stronger and more adaptable sales team.
- Make reports easily accessible to stakeholders: Accessibility not only entails making your report easy to find and open, but it also involves making it readable and understandable for those who need to act on it.
If your report will be accessed digitally, note that 16% of the world’s population live with disabilities and struggle with digital accessibility. Think of sales team members or execs with disabilities who need to access your report digitally. Make it easy for them by ensuring your report passes accessibility tests.
Boost Your Sales Performance with These Report Templates
Templates make the report-creating process easy and fast. They give your document a uniform and consistent formatting, improve accuracy, and ensure seamless sharing of key data with stakeholders.
However, you shouldn’t just pick any random template. You must carefully select the right one. For example, if you’re preparing a daily sales report, this template is an ideal option.
If you’re unsure of what template to use for your weekly, monthly, quarterly, and annual reports, check out our template library. You’ll find templates with elements you need to prepare an excellent report.
Remember, regular reporting improves communication, transparency, and accountability in any organization. It also helps to monitor performance and progress and drive strategic planning.
Creating brilliant reports is a breeze with Piktochart. Try now for free!