This post is part of our guide to using infographics in education.
I’m the instructional tech coordinator in a rural school district in Michigan. I love to think about transforming education. On a day to day basis, though, I have to be more concerned with small steps rather than radical change.
The teachers I work with want simple, somewhat different, and effective.
So this year, I put aside the plans I had to redefine school. (No one listened to them anyway!)
I started making what I call Tech Project Packs as a concise resource to help teachers easily add in a new tech component to existing lessons.
One of those Packs focuses on Piktochart as a tool for creating infographics. I’m sharing that resource below.
Infographics are my go-to option when I’m asked for “something easy, but that’s more than a PowerPoint.”
Whether the class just finished a traditional unit on The U.S. Civil War or a creative problem-based learning activity in Trigonometry, infographics are perfect for a final presentation of what the students learned.
And Piktochart is my favorite tool for making these. (See this example of one I created for my blog.) It’s intuitive to anyone who’s used to familiar programs for making slideshows. You can give it a try by signing up for free.
My Tech Project Packs are sort of like FAQs for tech tools. Here’s the one I made for Piktochart.
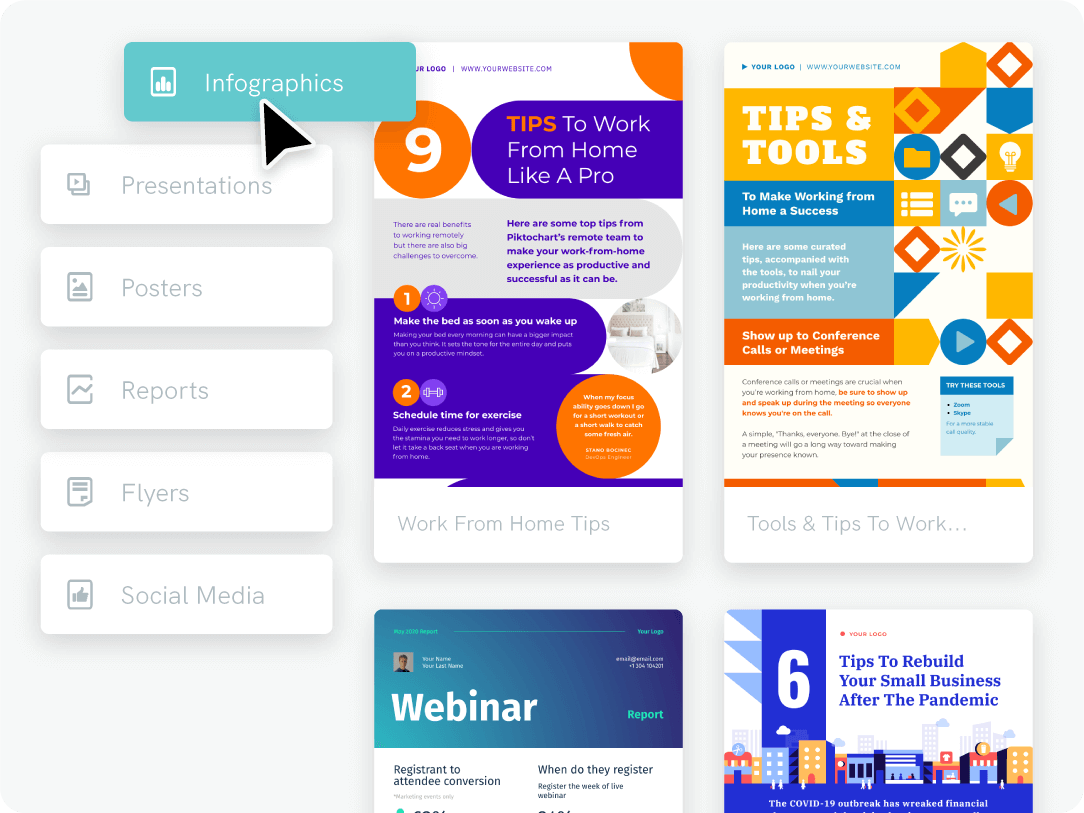
What is an infographic?
Infographics are those (usually tall and skinny) pictures we see on blogs or in our email that summarize complex topics in short phrases, stats and icons.
They’re sort of like slideshows that show all slides at once. But since they don’t have the benefit of a live presenter, they must completely and concisely present their message.
What are infographics best for?
- Use infographics if you normally would assign a “PowerPoint”, these can be a more contemporary format. No need to use those slideshow tools for presentations that won’t actually be presented live.
- Unlike a slideshow, an infographic has to speak for itself, showing all the relevant information concisely.
- They are perfect for any final product that has to summarize facts, provide evidence, persuade an audience, or teach others something new.
- If experiments or surveys result in interesting data, these are ideal for displaying charts and graphs. (See the tutorial below about using the graphing features of Piktochart). You can also check out examples of data-driven infographics for some inspiration.
- Topics the students are passionate about, including local issues, are excellent for this form of presentation. They are easy to share with the community through district Facebook pages or websites.
- If students already have a blog or website, these are a logical way to add new information to it.
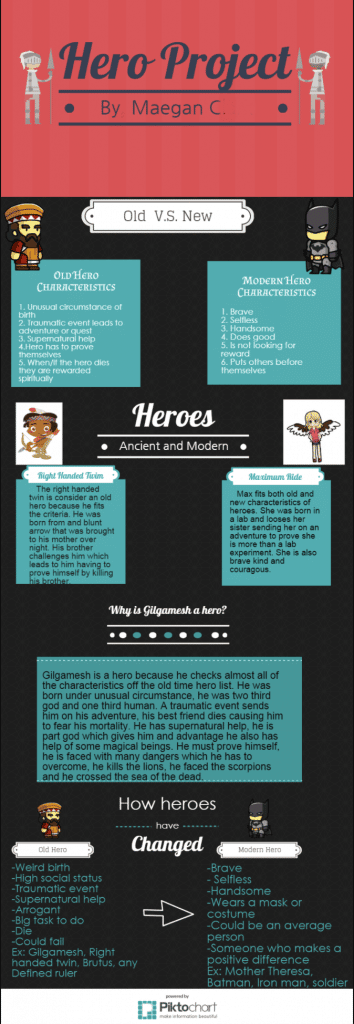
Example of an infographic by students plus classroom infographic templates you can use
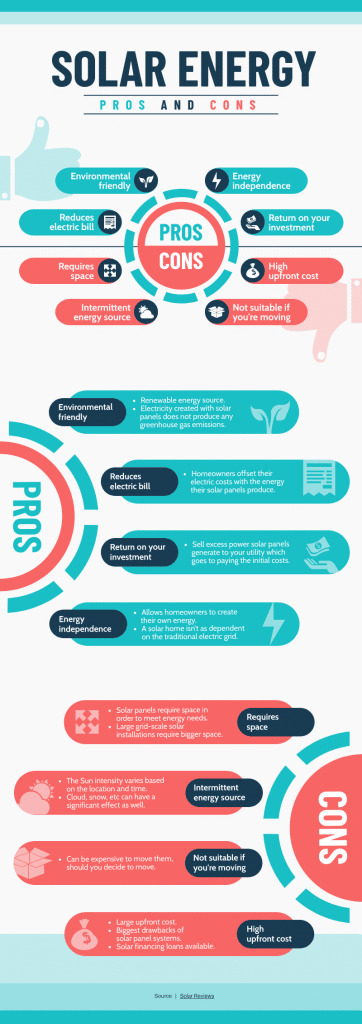
Here’s one that’s embedded on a website by a student:
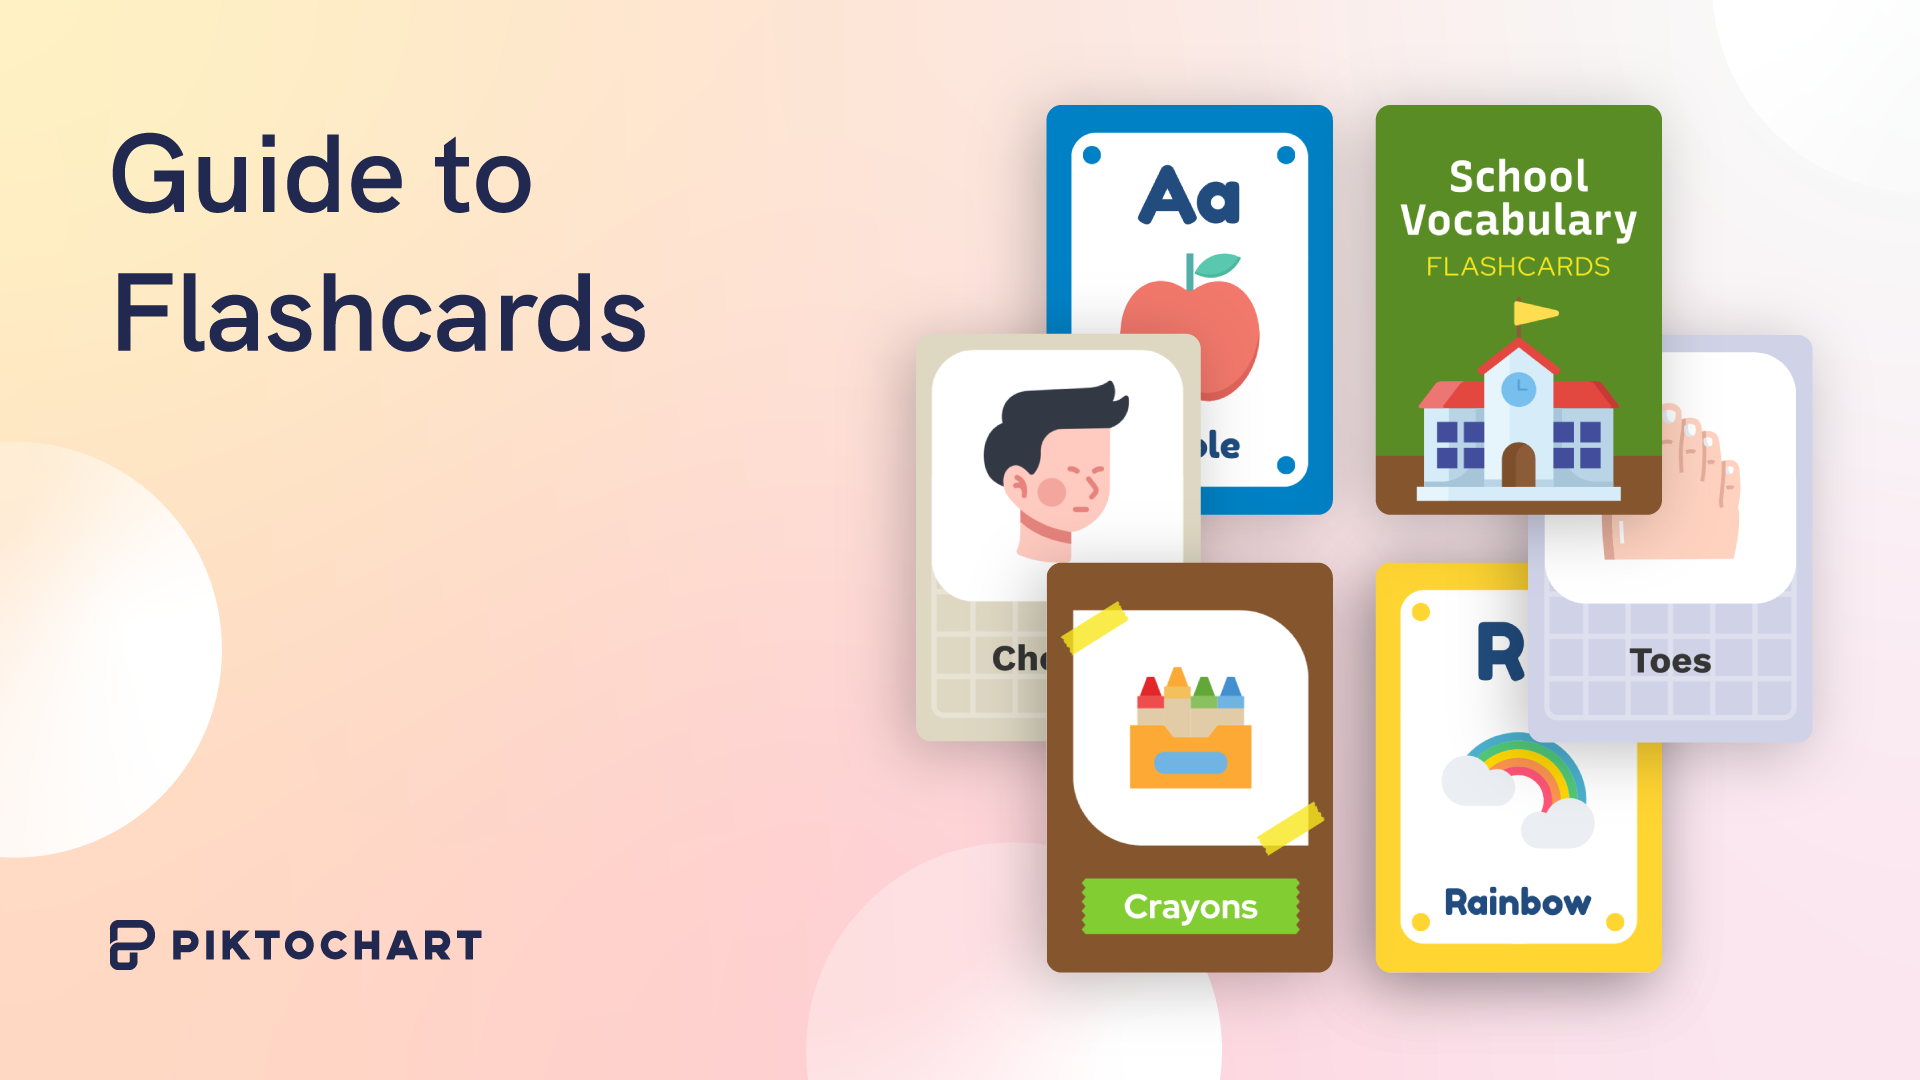
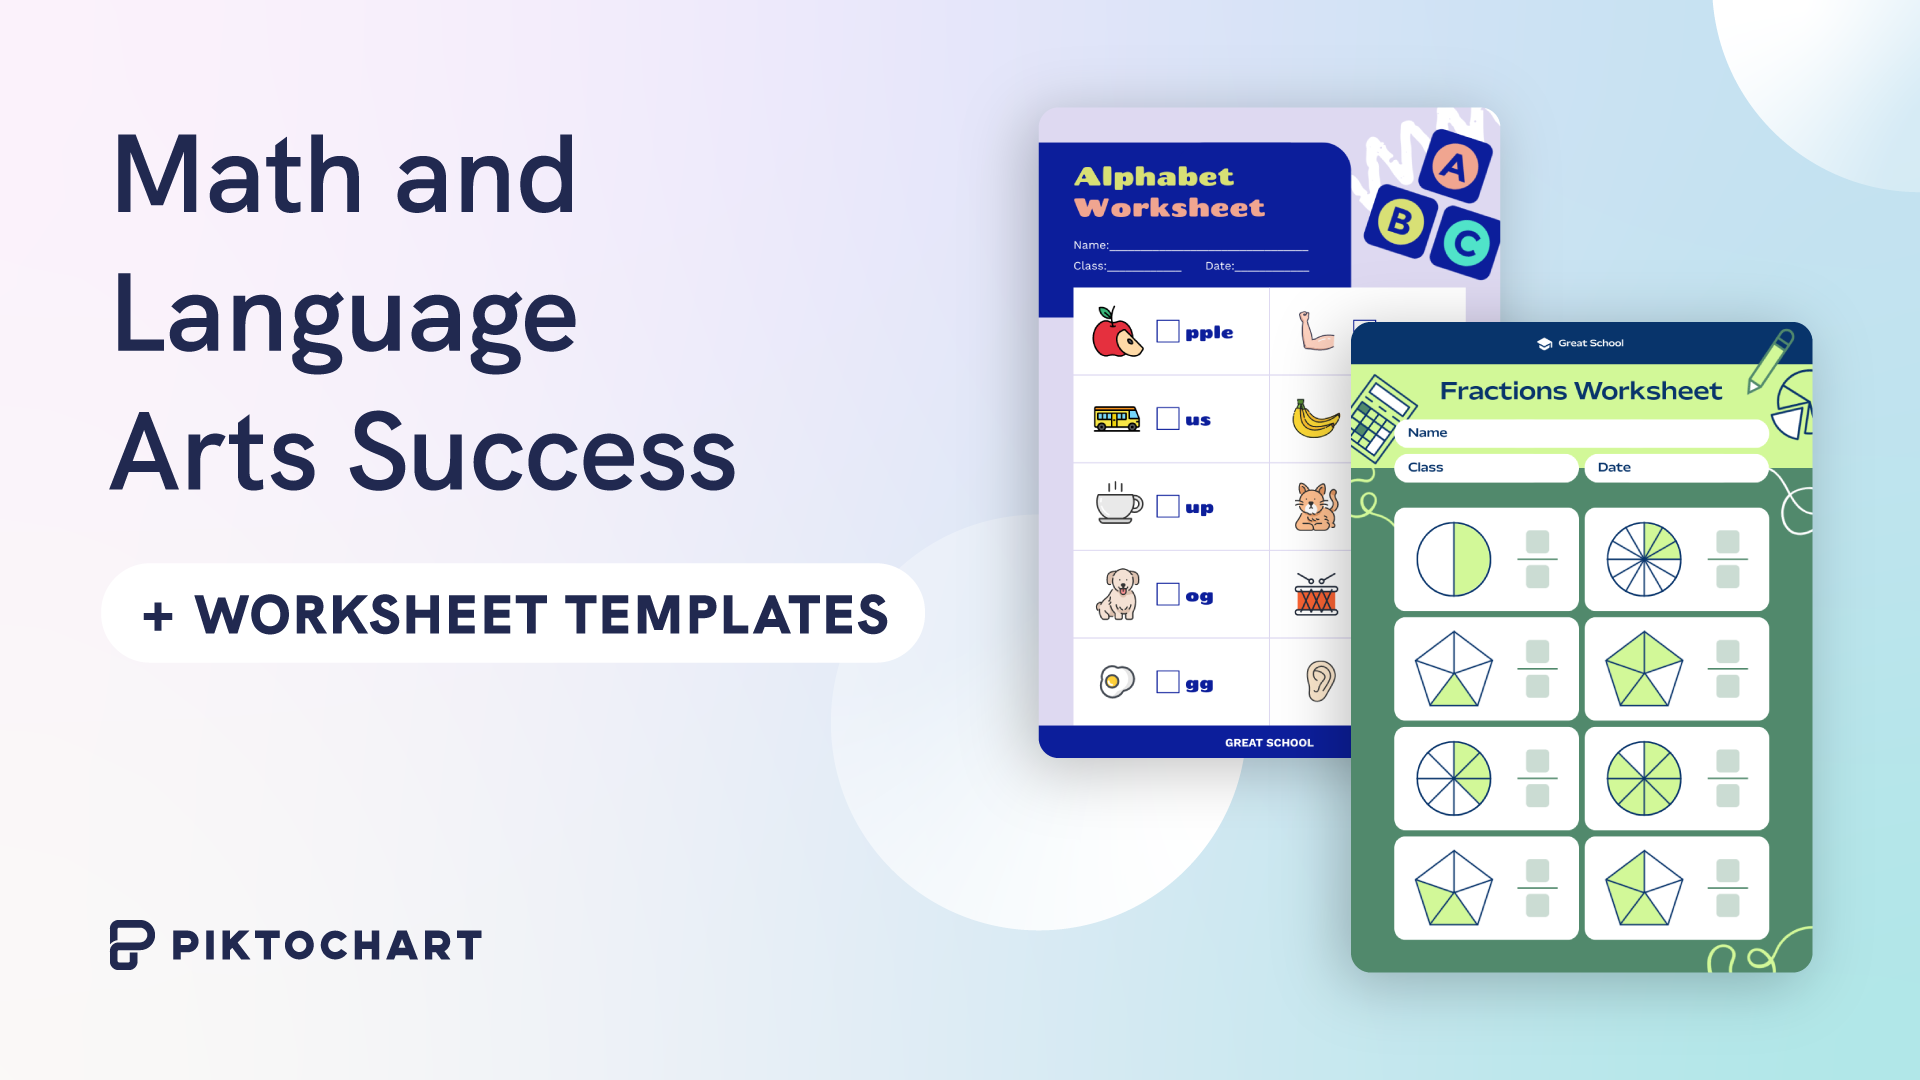
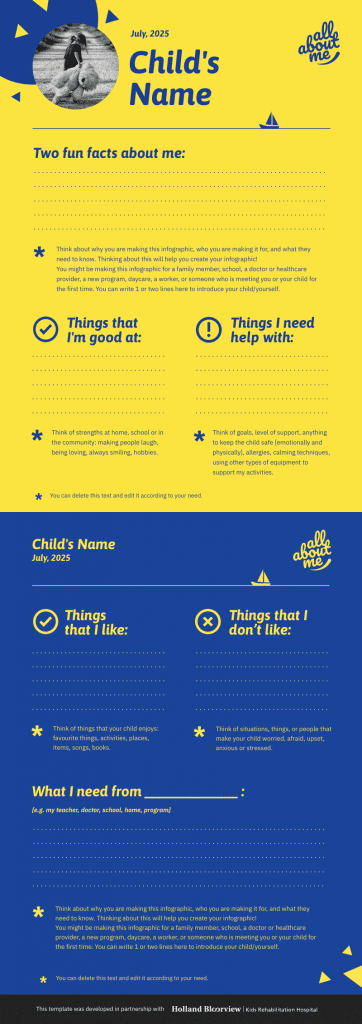
Here are a couple of classroom infographic templates that you can use with your students:
Encourage creativity in the classroom with infographics
Engage your students better in the classroom by going visual! Infographics help students express themselves and improve their critical thinking skills.
Try Piktochart for free
What tech tools are needed to make an infographic?
- Any Chromebook, computer, or iPad
- Piktochart – Students can log in on this site and choose the “Sign in with Google” option.
What are some possible challenges with this project?
- Students should be encouraged to use images that are free for reuse and they should cite their sources.
- Since it’s so similar to PowerPoint and Keynote, students might wonder why they can’t just use those tools. This is a great opportunity to highlight the advantages and appropriate use of infographics.
What’s the general outline for this project?
- Gather the information that will be in your infographic.
- Plan how you will word the information concisely. Infographics should not contain long sentences and wordy bullet points.
- Plan the organization, flow and the images you will want in your infographic.
- Go to Piktochart.com or open the Piktochart app and sign in with the “Sign in with Google” option.
- Use the tools there to build your infographic.
- Remember to cite sources for images and information.
- Download the infographic as a JPEG or PNG.
- Upload it to Google Drive or submit it through Google Classroom.
What should I include in my assignment directions?
- Indicate what students must include from your course content.
- Emphasize that text in infographics must be brief, clear and formatted in a way that enhances the message.
- Likewise, images should have a consistent style throughout, while each one clearly supports the main idea of the block it is in.
- If you expect to see graphs on the infographic, explain that students should use the graph tools in Piktochart.
- Indicate what options they have as far as content and the look of the infographic.
- Include the outline of directions above and possibly the link to one or more tutorials.
- Explain how students should submit it to you, either through Drive, Classroom or maybe posted on a website or blog.
Besides my course content, what grading criteria should I consider?
- Does the infographic show evidence of careful planning?
- Are ideas clearly communicated?
- Are the images and facts cited properly?
- Would it be appropriate to require at least one block that connects the course content to your community? (See the sharing beyond the classroom section below.)
- If appropriate for the students’ ages and the lesson content, you could require and evaluate how students share the infographic publicly.
What infographic video tutorials are available?
Follow along by creating a free account on Piktochart!
First, here’s a video tutorial for Piktochart beginners:
Here’s another video that is more specific to infographics:
What other options are there for expanding this project?
Normally, an infographic would be a summary of information posted on a website or blog. Students could write up a related article, then add their infographic as an image.
Piktochart also has Presentation mode. With the click of one button, students can share their infographics with the class in a slideshow format. Here’s a short video tutorial on how to present in Piktochart.
Piktochart’s presentation maker offers a lot more. Sign up for free and give it a try?
How can we share this project beyond the classroom?
As mentioned in several places above, infographics are easy to embed on blogs and websites. They also can be shared on social media like Twitter and Facebook.
Depending on the content and quality, the teacher could share them on a class website, blog or social media account.
If you included a requirement to connect the learning to local issues, be sure to share these with the community. The clear, concise presentation of important information can gets a lot of positive attention on a district Facebook page or the district website. Everyone wins when the community sees relevant learning taking place!
Piktochart offers special pricing for educators and students. With the education plan, you can collaborate with a team, create custom templates, upload and use your own fonts and brand assets, and more. Get started for free by creating an account.
Create engaging visuals for your next classroom or eLearning session!
Make visuals in minutes with ready-to-edit templates in various downloadable formats. Add and customize icons, images and charts. Get started for free. Upgrade to special pricing tailored for educators and students!
Sign up for free