
Want your business to run like a well-oiled machine? Figuring out the most efficient sequence for your production? Want to ensure service quality for your customers? Use workflow diagrams.
These graphic tools transform chaos into order and confusion into clarity. Workflow diagrams or workflow charts provide a clear visual guide for many different types of processes. It eliminates guesswork and provides a clear course of action that ensures tasks are completed more efficiently.
In this article, we give you a comprehensive overview of what workflow diagrams are, their various use cases, and how to make a workflow chart that improves your business process.
What Is a Workflow Chart?
A workflow chart is a visual representation of a business process that maps out the sequence of steps and the key people involved in every step from start to finish. It is also known as a workflow diagram, a process flowchart, or a process diagram.
The primary goal of a workflow diagram is to provide a clear overview of a business process workflow from start to finish. To do so, it uses standardized shapes and symbols to represent the different stages in a process. It then illustrates the sequence of steps that must be followed to complete the process. In many workflow charts, the people responsible for each step in the process are also clearly identified.
So, what are flow diagrams used for? These diagrams have many possible uses in different scenarios. Here are some of their common use cases:
Standardization
They provide a standard guide that makes sure that all processes are clear to everyone in the organization. They also help ensure that tasks are completed in a consistent manner in all instances.
For example, in a customer service workflow, a standardized chart ensures that all representatives follow the same steps when handling complaints, leading to consistent customer experiences.
Process Improvement
By outlining all the steps involved in a process or system, these charts help identify redundancies, bottlenecks, inefficiencies, and error-prone areas. They then enable organizations to make the necessary changes and optimize their workflows.
Employee Onboarding and Training
Representing key processes visually makes them easier to understand and remember. These visual representations of processes help new hires grasp complex workflows more quickly. This enhances efficiency and productivity.
Project Planning
Mapping out each step before a project is put into motion helps create an efficient workflow. It defines potential decision points and forecasts possible outcomes, making it easier for project managers to anticipate challenges and plan contingencies more effectively. This structured process mapping also helps troubleshoot problem areas before starting operations.
What are the Different Types of Workflow Charts?
While there are many types of workflow charts, we’ll focus on the most commonly used ones in business processes. Each type is tailored for a specific application and can be customized to suit the uniqueness of a particular process.
Process Flowchart
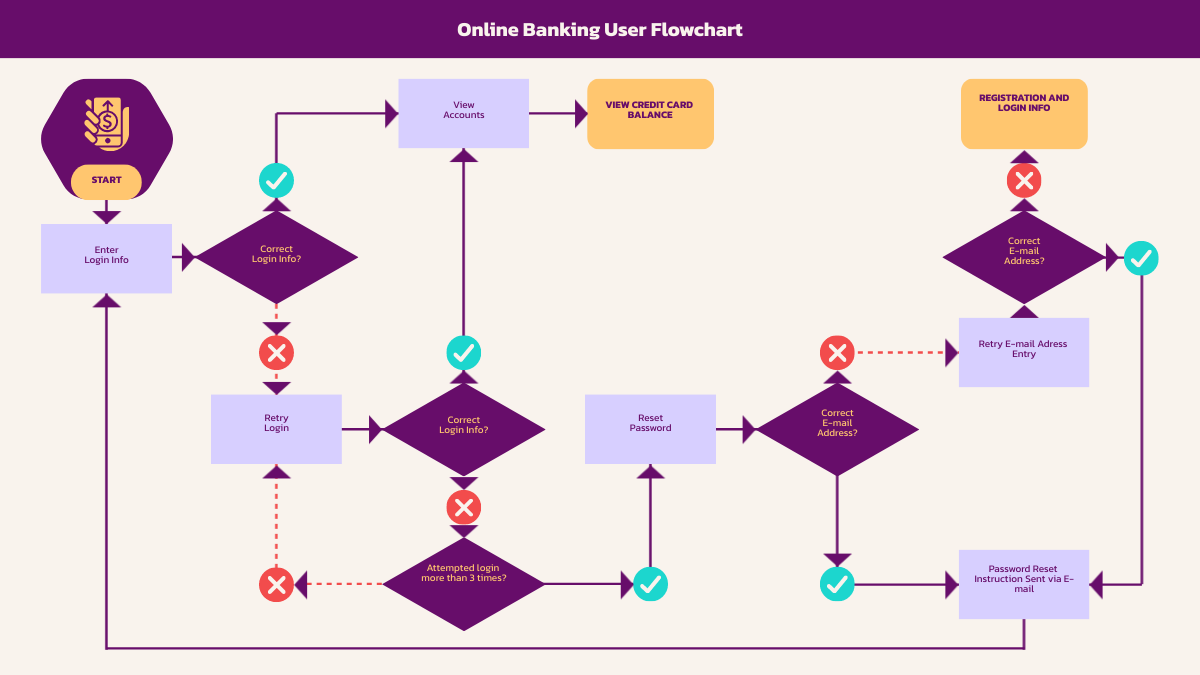
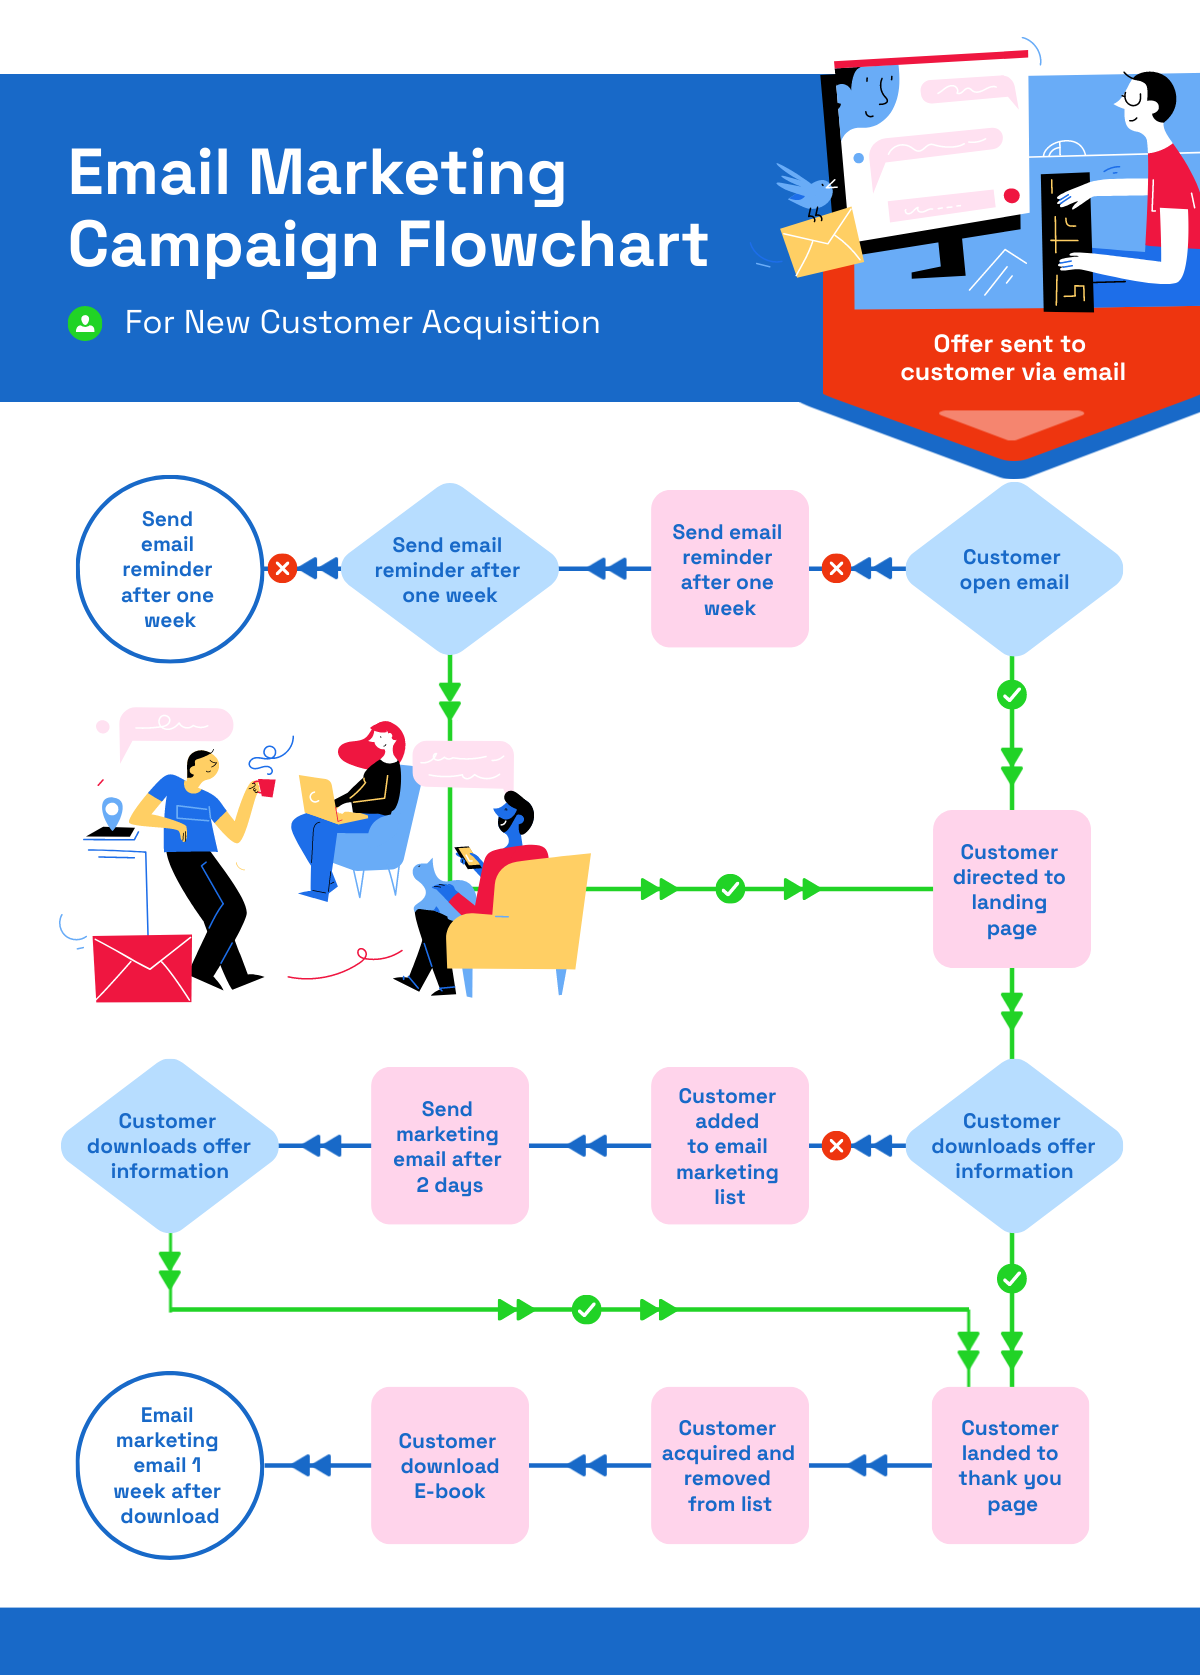
A process flowchart or data flow diagram is the most common workflow diagram. It simply maps out the steps from start to end using the standard symbols many are familiar with. Process flowcharts are particularly effective for mapping linear processes with clear start and end points, such as a product assembly line or a customer onboarding sequence.
Swimlane Diagram
Need to clarify who does what? Swim lane diagrams are your go-to workflow diagrams. Often used to visualize a multi-factor process involving several departments, they eliminate confusion about roles and responsibilities. They also provide a high-level view of how all the steps and people involved work together to complete the entire process.
This chart divides a workflow process into categories or lanes. Each lane is assigned to a department or key person responsible for all the steps within that specific lane. Because it clearly shows roles and responsibilities, the swim lane diagram is ideal for use in project management, process documentation, internal workflow optimization, and employee onboarding.
BPMN Diagram
Using the Business Process Modeling Notation, this workflow diagram is used primarily within business functions and information technology processes. Its focus is more on the internal processes rather than the output, making it quite useful for workflow management.
Designed mainly for business and technical use, it shows the sequence of a business operation or the flow of information. For instance, in software development, a BPMN diagram can be used to model the different outcomes that arise from different inputs. This allows developers to spot loopholes or errors before a new program is deployed.
In human resource management, it can help visualize multi-step processes such as leave applications that go through several reviews before final approval.
SIPOC Diagram
SIPOC stands for Supplier-Input-Process-Output-Customer. As the name implies, this diagram identifies the key elements involved in a business process and outlines the flow of events from suppliers to customers. Think of it as a mix of a flowchart and a swim lane diagram.
The main focus of an SIPOC diagram is to identify the inputs and outputs of a process and all the steps needed to streamline the flow from one point to another. It is often used in manufacturing processes, business development projects, and product launches. It is quite useful in tracking vendors, materials, products, and end users.
These are just a handful of the many different workflow diagram examples. There’s also the ANSI Flowchart, which uses symbols from the American National Standards Institute and is commonly used within organizations in the country. There’s also the UML Activity Diagram, which uses Unified Modeling Language for mapping activities in software development.
Are flowcharts and workflow charts the same?
You also may have noticed that the diagrams above look similar to flowcharts. Are flowcharts and workflow charts the same? Not really.
Although they may sometimes be used interchangeably, workflow charts have distinct use cases. Flowcharts are versatile and can be used across many different fields, even in mapping out personal decisions. On the other hand, workflow diagrams specifically focus on mapping out business processes. They map out the data flow, document routing, operational system, and other core processes within an organization.
What Makes a Good Workflow Chart?
Creating an effective workflow is key to improving clarity and efficiency. Here are some key elements to consider when you create and use a workflow diagram template or create your own from scratch:
Simple and easy to follow
A good flow diagram is straightforward and easy to understand at a glance. There are no unnecessary details that overwhelm the viewer. The key steps are clear, and their sequence is easy to follow. The start and end are defined, and every step in a process follows a linear and chronological order.
Tailored to the right audience
The purpose and the audience of the diagram are clear. The diagram must be more than just a pretty picture to look at. It should convey all the key information (data, decisions, systems, people, etc.) in a language that the audience understands. This means no technical jargon for non-technical users.
Consistently use symbols and shapes
A good workflow diagram includes standard symbols and shapes. This uniformity helps users grasp the process without having to decipher unfamiliar symbols. The most common shapes you’ll see in a workflow chart include:
- Ovals. These denote the start and end points of a process.
- Rectangles. These are instructions, actions, or steps that lead to decisions or endpoints.
- Diamonds. These are decision points from where separate paths can be taken depending on the choices made.
- Circles. These are connectors that represent jumps in actions or instances that can be skipped.
- Arrows and Lines. These point towards the next step or connect the different shapes. These are important as they show the flow and sequence of actions.
If you consistently choose the same set of symbols, it becomes easier knowing which ones you should use to help users navigate the chart.
Includes input from stakeholders
An effective workflow chart is not made by a single person. It is a product of collaborative effort from all stakeholders. Gathering input and feedback from all team members involved makes sure that nothing is overlooked.
In the next section, we outline the basic steps for creating a workflow diagram. As you go through the steps, keep in mind the key elements we mentioned above.
How To Create a Workflow Chart
Creating a workflow chart is a systematic process that involves several steps that vary depending on the specific use case. This guide includes the basic steps needed to develop a clear and effective workflow chart for your organization.
1. Identify the process to be visualized
First, pinpoint the exact process you want to map out. Is it a business process, a manufacturing process, or something else? If you’re new to workflow charting, start with a simple, well-defined process. Tackle complex processes once you’ve familiarized yourself with how flow diagrams work.
Be clear about the process and the audience for your chart. Understanding who will use the chart and why it’s being created helps determine the language and level of detail needed. For instance, using industry-specific jargon might be appropriate for a technical team but not for a general audience.
2. Determine start and endpoints.
Define the scope of your workflow by identifying the start and end points. If the process has multiple possible outcomes, write down each potential endpoint. This step ensures your chart has clear boundaries and objectives.
3. List out all the steps involved.
Identify and list all the key steps involved in the process. Focus on essential steps and decision points that may branch off along the way. Initially, outline these steps without worrying about the order. The goal here is to identify every necessary action and decision point.
4. Arrange steps in sequential order.
Once you have all the steps listed down, organize them in the correct sequential order. Determine the flow and identify stakeholders involved in each step. Look for repetitive steps, unnecessary approvals, or long waiting periods between tasks. These are often opportunities for optimization, and will help streamline the process to make the workflow more efficient.
5. Select the appropriate workflow chart type.
Choose the type of workflow chart that best suits your needs. Keep in mind the primary purpose of your diagram when selecting the right type. Tools like Piktochart offer templates that can be edited and customized. Modify the text, add or delete shapes, and select an appropriate chart type to represent your process accurately.
6. Use proper shapes and symbols.
Use standardized symbols and shapes to represent different elements of the process. Rectangles for tasks, diamonds for decisions, and arrows for flow directions are common choices. Consistency in using these symbols helps ensure clarity and readability.
7. Review, refine, and share with stakeholders.
Finally, review the chart for accuracy and clarity. Make revisions if the process flow is unclear or if you spot any inaccuracies. Ensure the chart is easy to understand and does not appear cluttered with unnecessary information. Then, share it with stakeholders for their feedback. Incorporate their input and make any necessary adjustments to finalize the chart.
These steps serve as a guide in creating a chart that effectively improves your business processes. If you’re using templates, remember to use those that are easy to customize.
Improve Efficiency and Productivity with the Right Type of Diagram
When created properly, workflow diagrams become powerful tools that enhance business efficiency and productivity. They break down complex business processes into more manageable steps and clearly map out the right flow of tasks, decisions, and responsibilities.
A well-designed workflow diagram can help your business identify areas for improvement, maintain consistency in service quality, and streamline operations, among many others. Ultimately, it boosts business growth.
Use the tips we mentioned above to start mapping out your own processes. To make workflow diagrams more effective, use Piktochart templates and customize them according to your needs.