Free online flowchart maker to create professional flowcharts
Piktochart’s flowchart creator and professional flowchart templates have everything you need to visualize complex processes and steps.

Flowchart tool loved and used by brands of all shapes and sizes worldwide, including the United Nations, Accenture, and Disney.


Simplify your design workflows with Piktochart’s intuitive flowchart maker.
The best free online flowchart maker is intuitive, simple, and easy to use. Just like Piktochart.
Whether you’re presenting a complex concept at work or explaining a process in school, make professional-looking flowcharts without downloading bulky software. Do everything online and get your professional flowcharts all done in minutes.
From traditional flowchart shapes and symbols to millions of flowchart icons to choose from, creating flowcharts with Piktochart’s flowchart maker is as easy as picking a template, a quick drag and drop of the shapes and flowchart symbols within, editing the text, and customizing the colors.
Piktochart’s in-house design team of professionals are the creative folks behind the intuitive flowchart software and diagram templates. This means you’re getting thoughtfully-designed templates to help you create flowcharts, fast-track your workflows, and present complicated procedures with no fuss.
With Piktochart’s free flowchart maker and chart creator, you can get the look you want for your flow chart with just a few clicks!

Save time and make stunning flowcharts fast with flowchart templates


Our library is updated frequently
Visualize diagrams and build beautiful flowcharts even without design experience.
Piktochart’s free flowchart creator is the go-to tool to map out complex concepts, customer journeys, information hierarchies, organizational charts, process charts,, methods, and steps.
Start with and create a flowchart or chart template and change the steps as you go. Edit the texts and pick your preferred fonts and colors.
Want to change your flowchart symbols and components? Piktochart is so easy to customize! Our extensive shape library, plus millions of icons has everything you need to visualize data and build customized charts quickly and easily.
Piktochart is also free to use. Designed for simplicity, you can learn the ins and outs of the online, flowchart tool maker in minutes.
Try Piktochart for freeGet all the features you need to create flowcharts that stand out
Piktochart’s free flowchart software comes with all the templates and flexibility you need to create beautiful diagrams, charts, and workflows.
How to Create Your Own Flowchart in 5 Easy Steps
Ready to create your first online process flowchart? Follow the simple steps below to create a flowchart and make your processes and steps clearer and more concise.
1. Get started with Piktochart for free.
Go to your Piktochart dashboard and choose Flowcharts as your format of choice. Not a Piktochart user yet? Piktochart is completely free. Sign up now.
2. Choose the best flowchart diagrams for you.
No need to start with a blank canvas! Start creating your flow chart creator by browsing through the free flowchart templates and flowchart examples. Pick the best flowchart symbol or chart page to start building your beautiful, unique flowchart.
3. Get creative and customize your template.
Piktochart’s templates for interactive flowchart and charts are fully customizable. You can add new shapes and placeholders from the left side and rearrange them as you please. For example, you can swap squares for circles or adjust their sizes. You can also replace lines with arrows.
Not too sure about the default fonts on your template? Experiment by changing the font styles and typography of your template.
Finally, add photos, change colors, and customize it based on your flowchart creation goals.
4. Save your work.
Double-check for typos. Make sure you don’t miss the most important details of your flowchart.
5. Share your flowchart with the whole team.
Great job! It’s time to share your flowchart, online, in person, or via email.
Download your flowchart page in PNG or PDF that’s ready to print. Or get a link for easy sharing via email or social media. With Piktochart’s flowchart creator, visualizing methods and explaining steps don’t have to be overwhelming. What’s more? You can start collaborating with your team in real-time, add comments, edit, give feedback, and more with a Piktochart account.

Find inspiration in every template
One flowchart tool, endless ways to simplify your processes and workflows.
- Add your information and customize it with just a few clicks.
- Next, swap or move lines and shapes with an easy drag and drop.
- Share online and present your flowchart designs with a downloadable PNG or PDF or get a private link that you can share quickly.
Create now
Frequently asked questions about how to make flowcharts online
The most common types of flowcharts are:
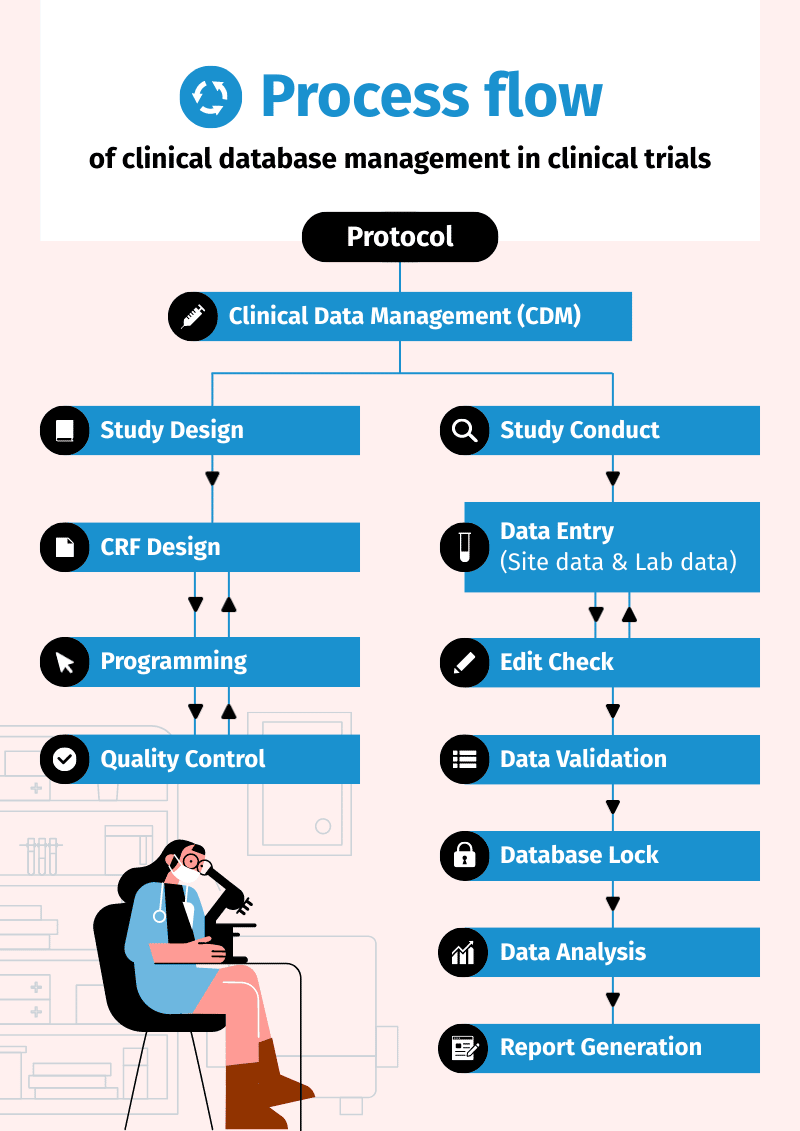
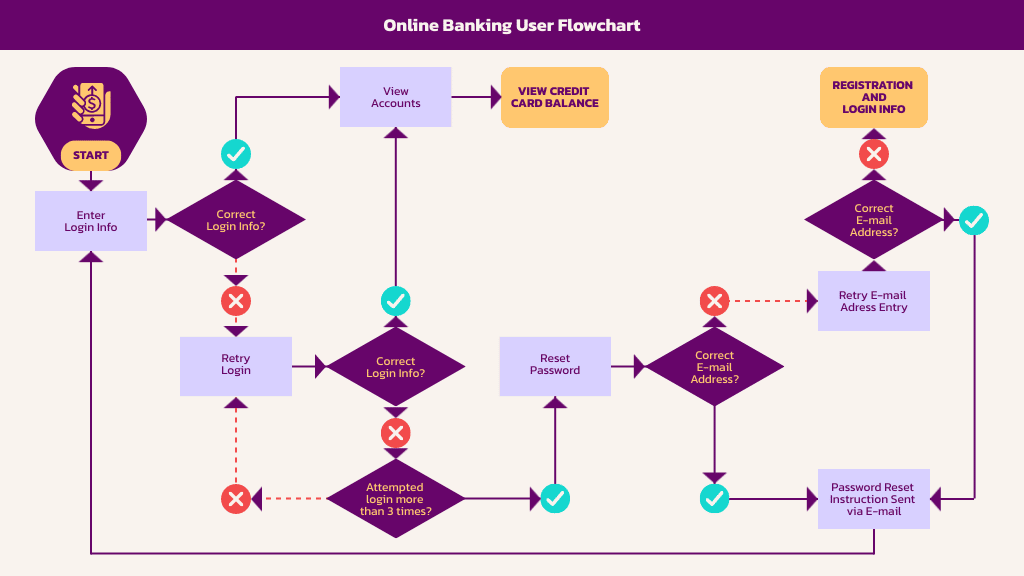
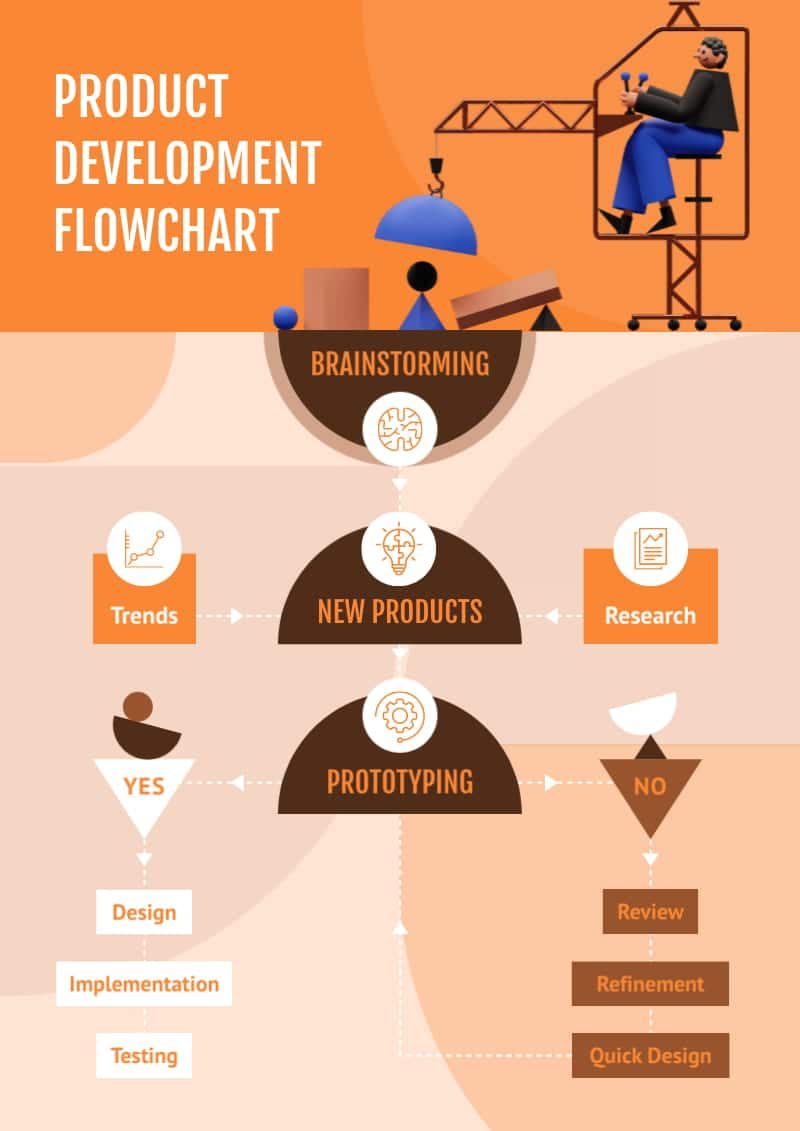
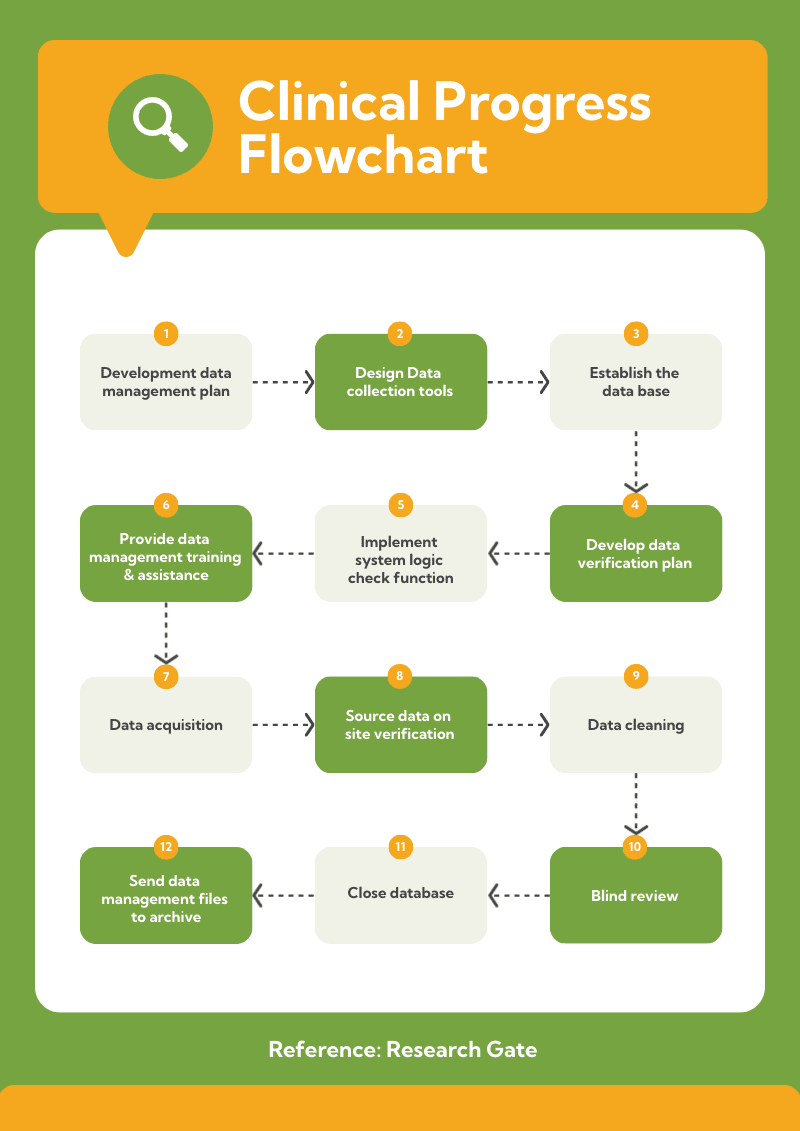
- Process flowchart – Highlight steps in a process in sequential order.
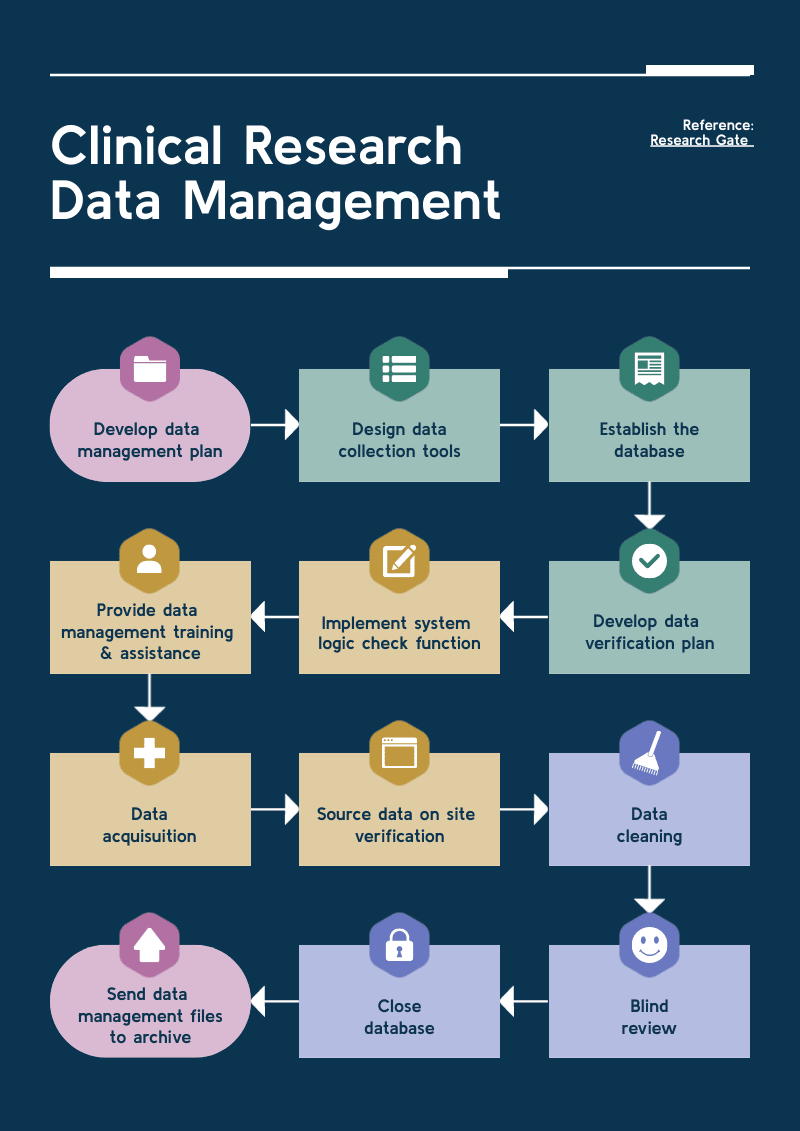
- Workflow chart – Illustrate a series of actions in a workflow.
- Data flow chart – Show how data is processed within a framework or system.
- Swimlane flowchart – A flowchart with a swimlane component is ideal for showing the steps along with information about the responsible teams or departments.
- Brainstorm ideas in sequence
- Create site maps
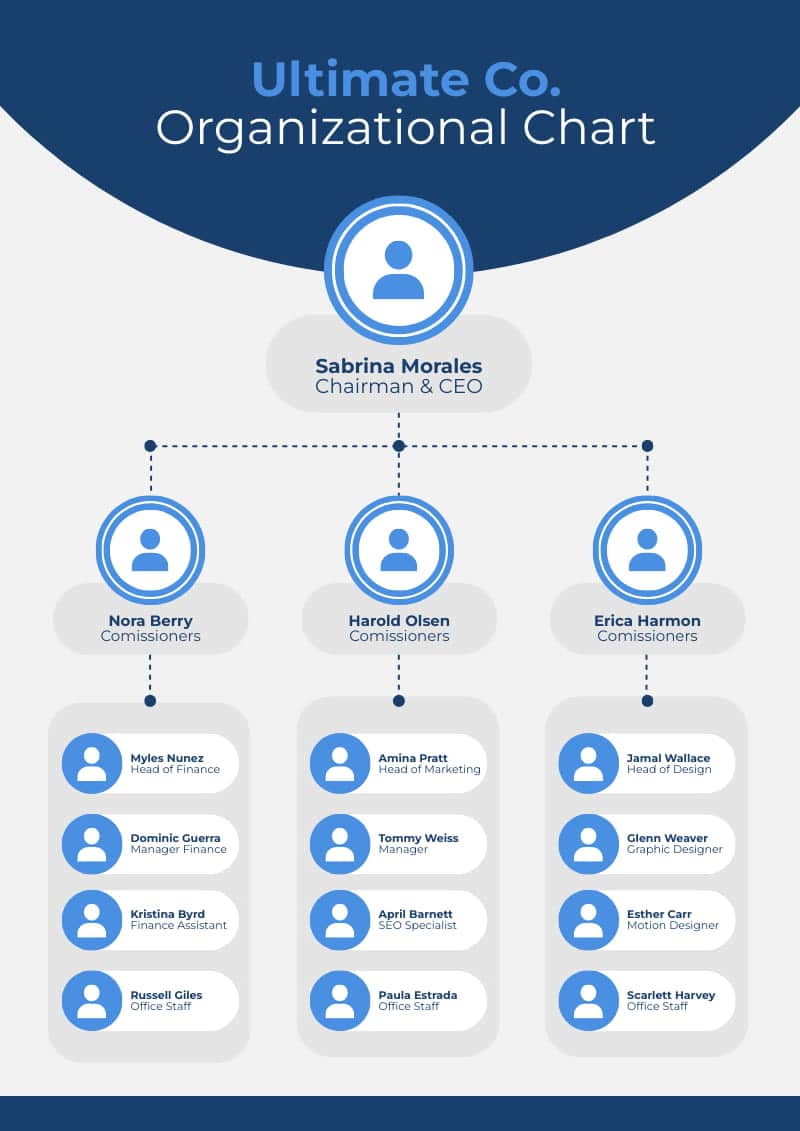
- Create organizational charts
- Design systems
- Document processes and tasks
- Explain decision-making processes
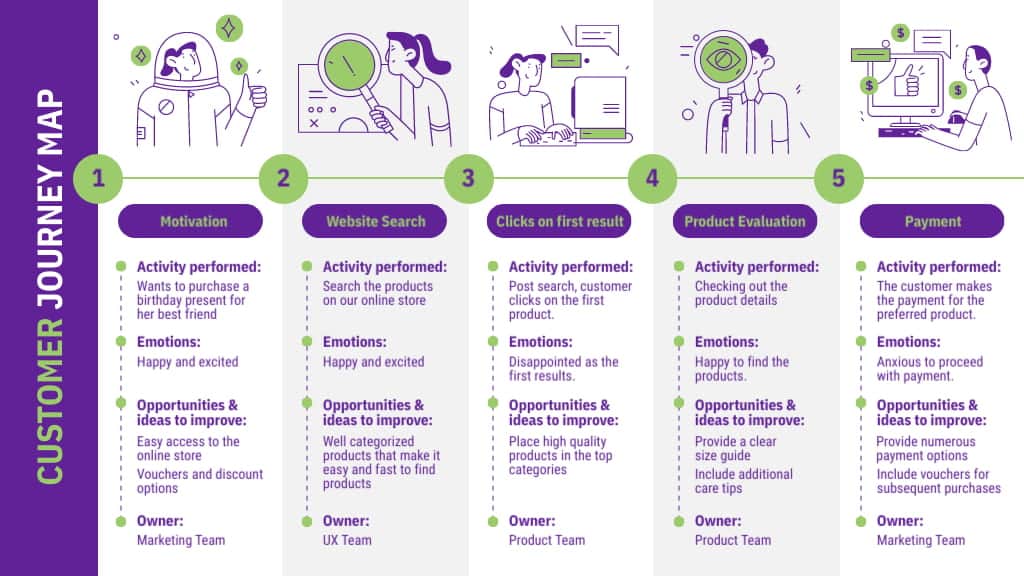
- Make visual user journeys
- Present solutions
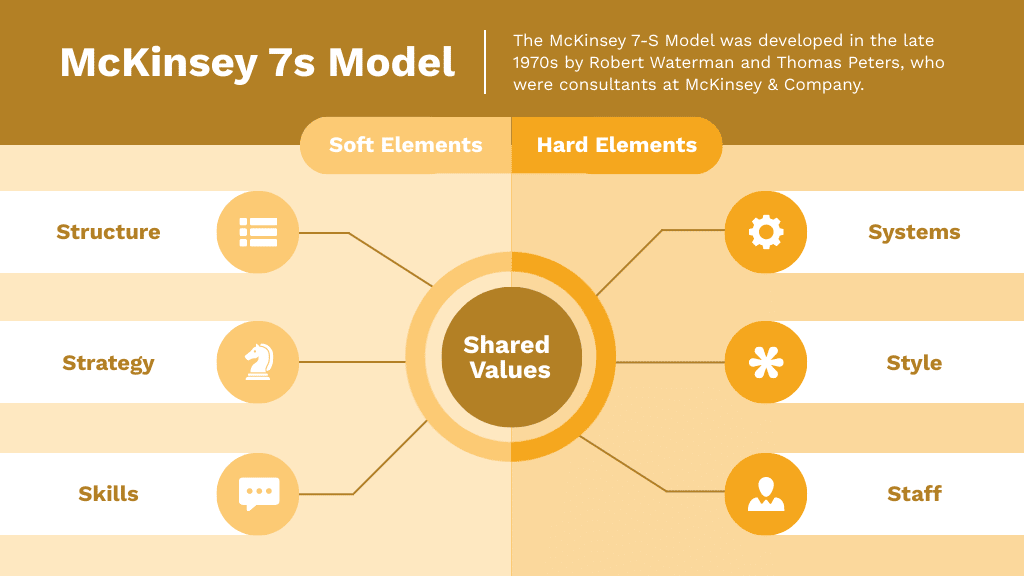
- Oval – stands for the start and end points of the process
- Rectangle – stands for a step within the process
- Diamond – stands for a decision that needs to be made
- Input/output symbol – stands for information leaving or entering the process
- Arrows – stands for a directional path
A flowchart is a type of diagram showing a process’s flow, from start to finish. It uses standard symbols and arrows to represent the steps in the process, along with decision points, inputs and outputs, and loops. The purpose of a flowchart is to visualize a process in a clear and structured way, making it easier to understand, analyze, and improve. These are commonly used in software development, project management, engineering, and other technical fields.
On the other hand, a diagram is a broader term that refers to any visual representation that conveys information or ideas. Diagrams can take many forms, such as charts, graphs, maps, or tables, and can be used to represent anything from data sets to conceptual frameworks. The purpose of a diagram is to simplify complex information, highlight patterns and relationships, and communicate ideas visually. Diagrams are used in various fields, from science and academia to business and marketing.