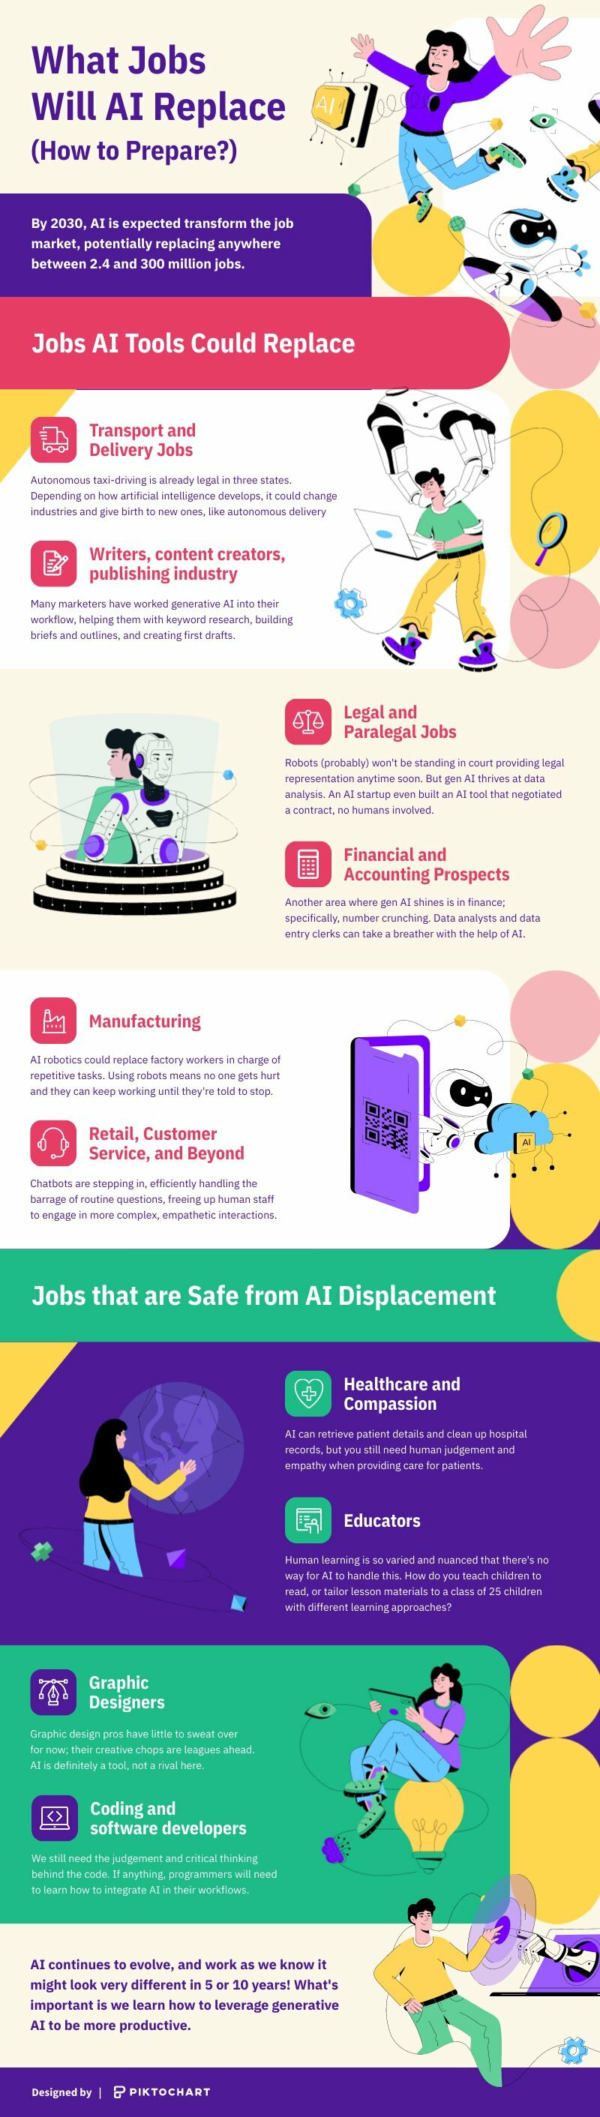
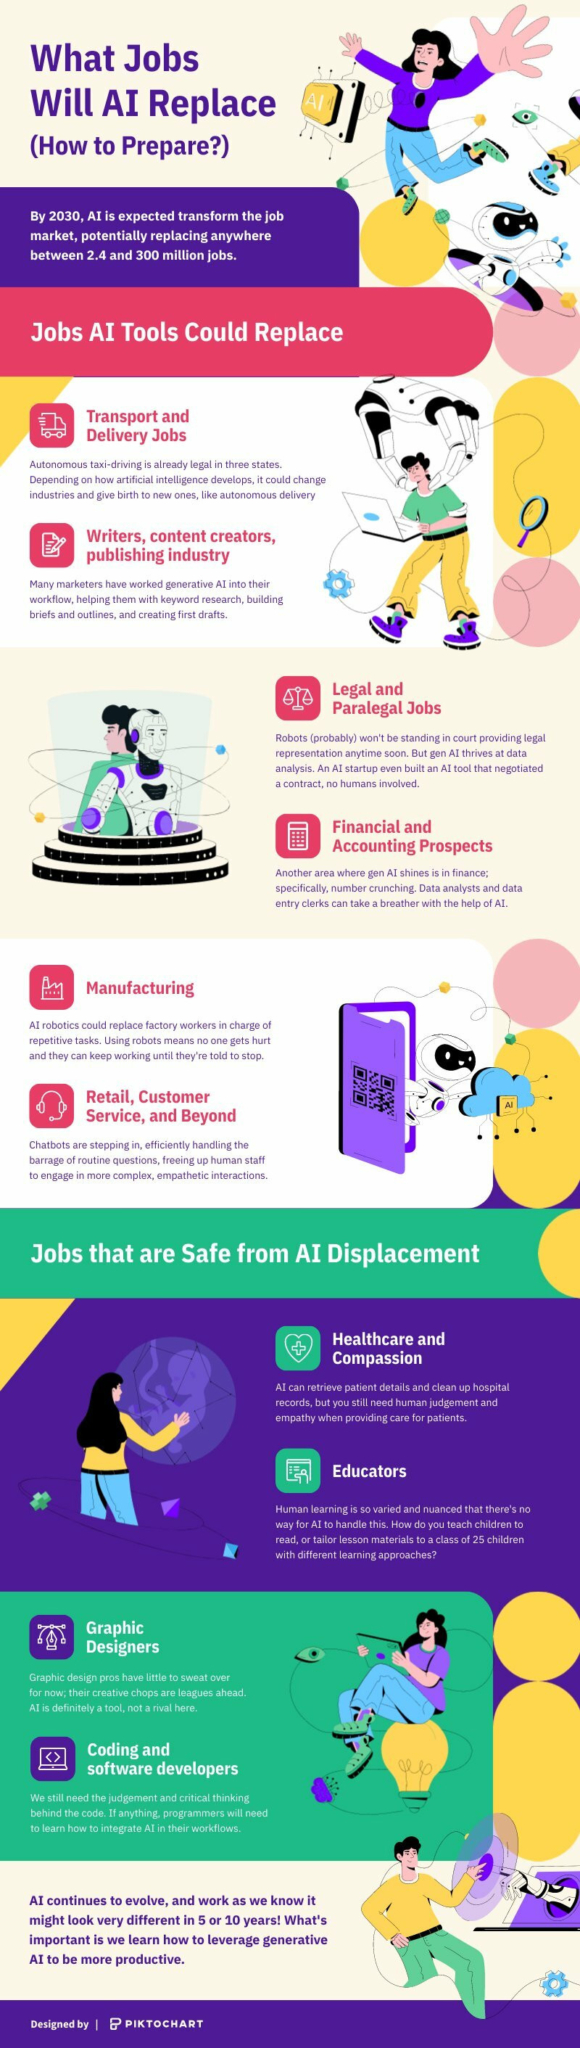
What Jobs Will AI Replace
Infographics
Edit for freeYou'll be asked to log in or sign up for a free Piktochart account first.
Creating an infographic about "What Jobs Will AI Replace" using Piktochart's templates is a straightforward process that allows you to convey complex information visually. Here are five simple steps to guide you through it: 1. Log in to Piktochart: Start by logging in to your Piktochart account or signing up if you don't have one. Piktochart offers a user-friendly platform that simplifies the infographic design process. 2. Select a Template: Once you're logged in, choose a suitable template for your infographic. Look for one that suits your style and preferences or search for templates related to artificial intelligence or job automation. 3. Organize Data: Gather data on which jobs are at risk of being replaced by AI. Categorize this data into sections, such as "High Risk," "Moderate Risk," and "Low Risk" jobs, based on their susceptibility to automation. 4. Visualize Data: Use Piktochart's tools to create visual representations of your data. You can add icons, charts, and graphs to illustrate the potential impact of AI on different job categories. Ensure that your visuals are clear and easy to understand. 5. Add Descriptions: Provide brief descriptions or labels for each job category to clarify the information presented. Use concise language to explain why certain jobs are more vulnerable to AI disruption than others. In conclusion, Piktochart's templates make it easy to create an informative infographic about "What Jobs Will AI Replace." By following these five steps, you can effectively visualize and communicate the potential impact of AI on different job sectors. Remember to keep your language simple and your visuals clear to ensure that your infographic is both educational and visually appealing.
Available File Type
Customization
100% customizable
Tags
More Templates Like This
 Infographics
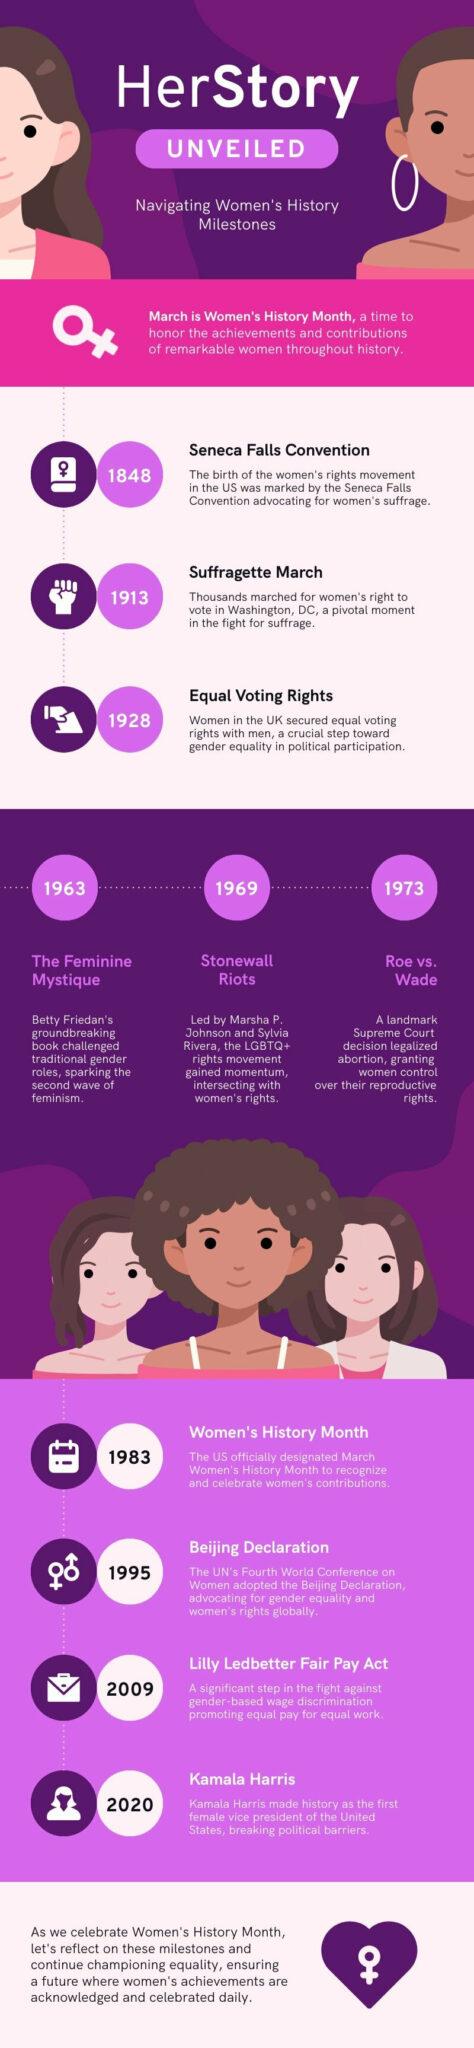
International Women’s Day Infographic
Infographics
International Women’s Day Infographic
 Infographics
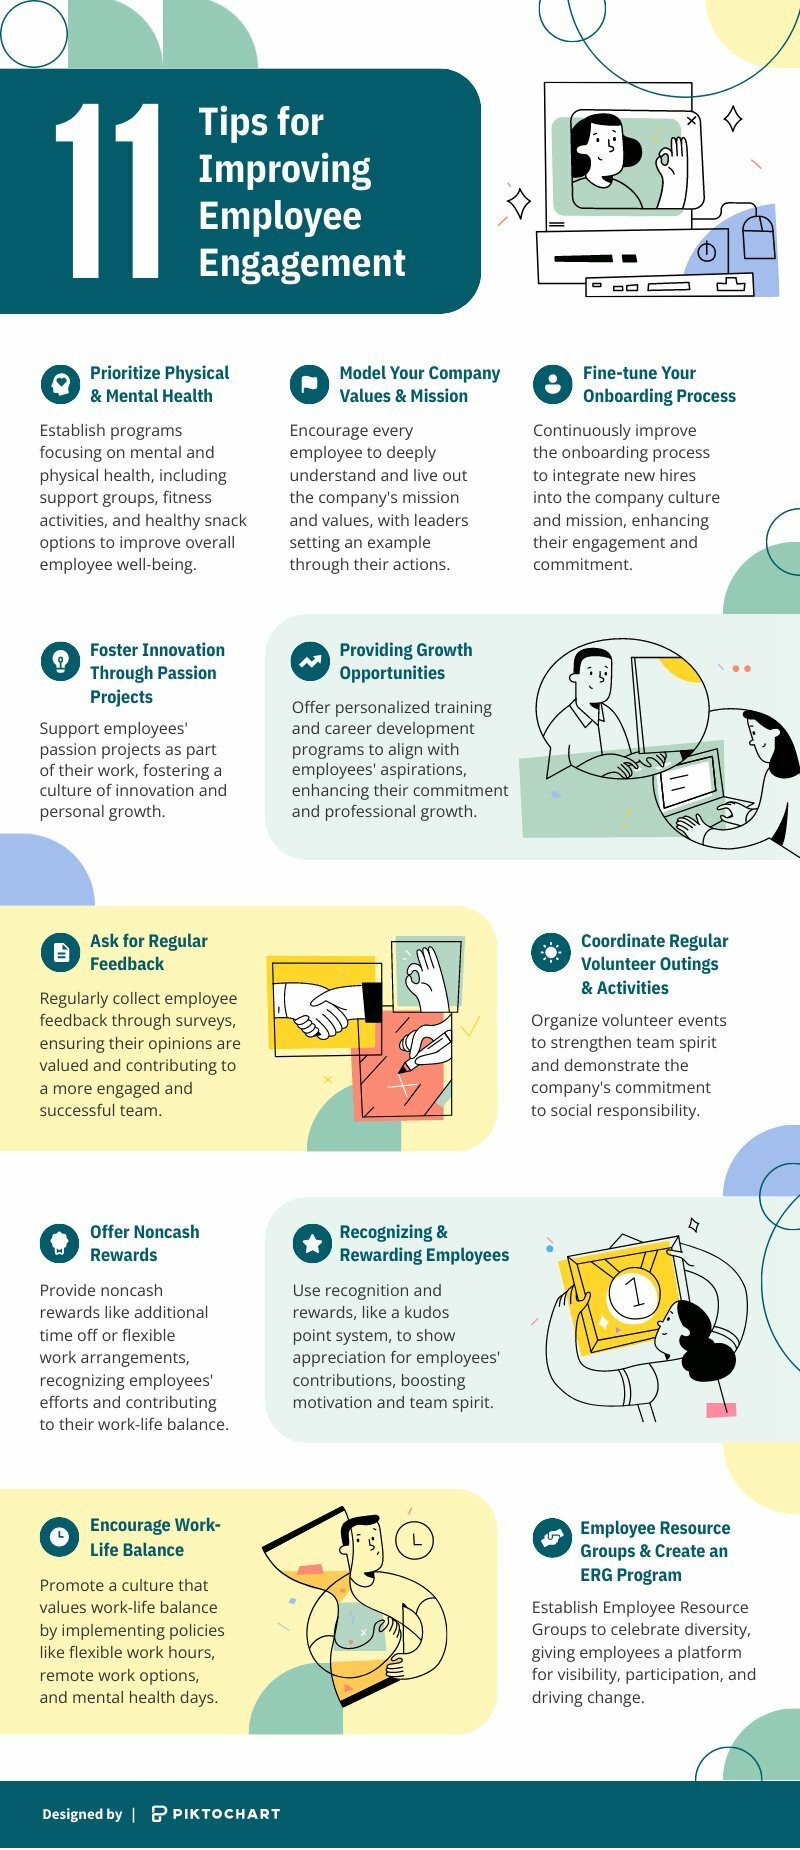
Tips for Improving Employee Engagement
Infographics
Tips for Improving Employee Engagement
 Infographics
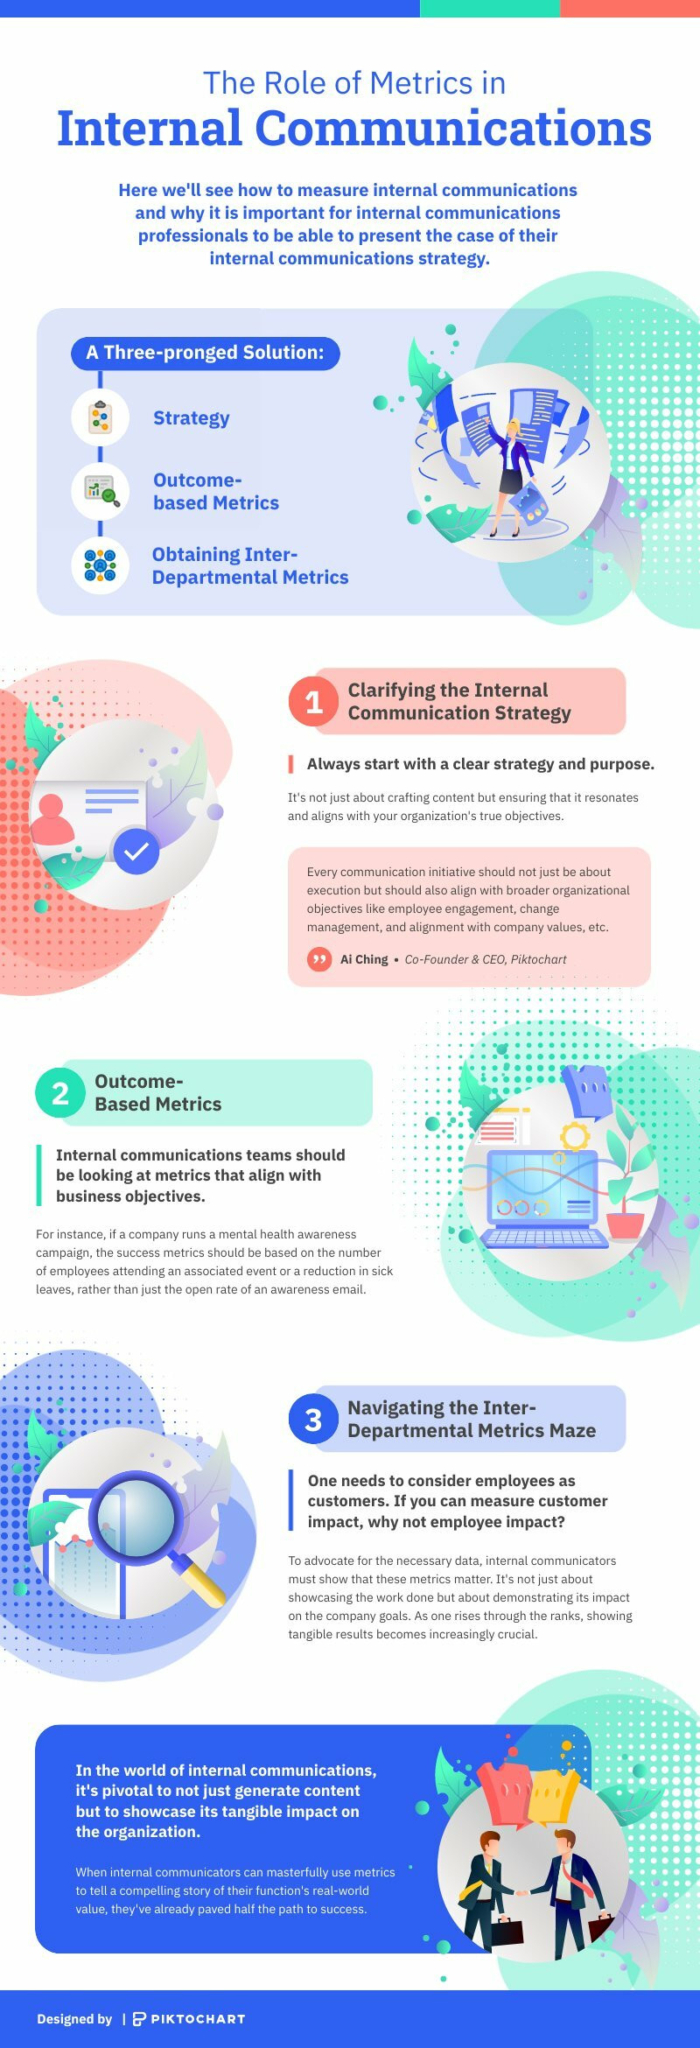
The Role Of Metrics In Internal Communications
Infographics
The Role Of Metrics In Internal Communications
 Infographics
Black Historical Figures Infographic
Infographics
Black Historical Figures Infographic
 Infographics
Facts About Women’s History Month
Infographics
Facts About Women’s History Month
 Infographics
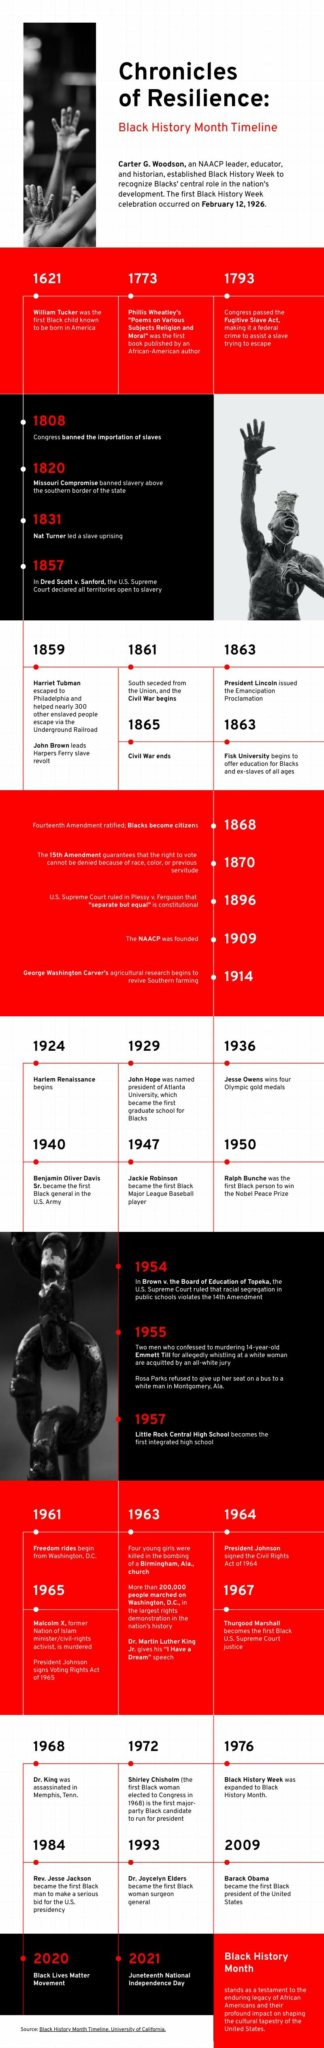
History of Black History Month Infographic
Infographics
History of Black History Month Infographic
 Infographics
What Jobs Will AI Replace
Infographics
What Jobs Will AI Replace
 Infographics
AI Carbon Footprint
Infographics
AI Carbon Footprint
 Infographics
Modern Mental Health Statistics
Infographics
Modern Mental Health Statistics
 Infographics
Mental Health Facts
Infographics
Mental Health Facts
 Infographics
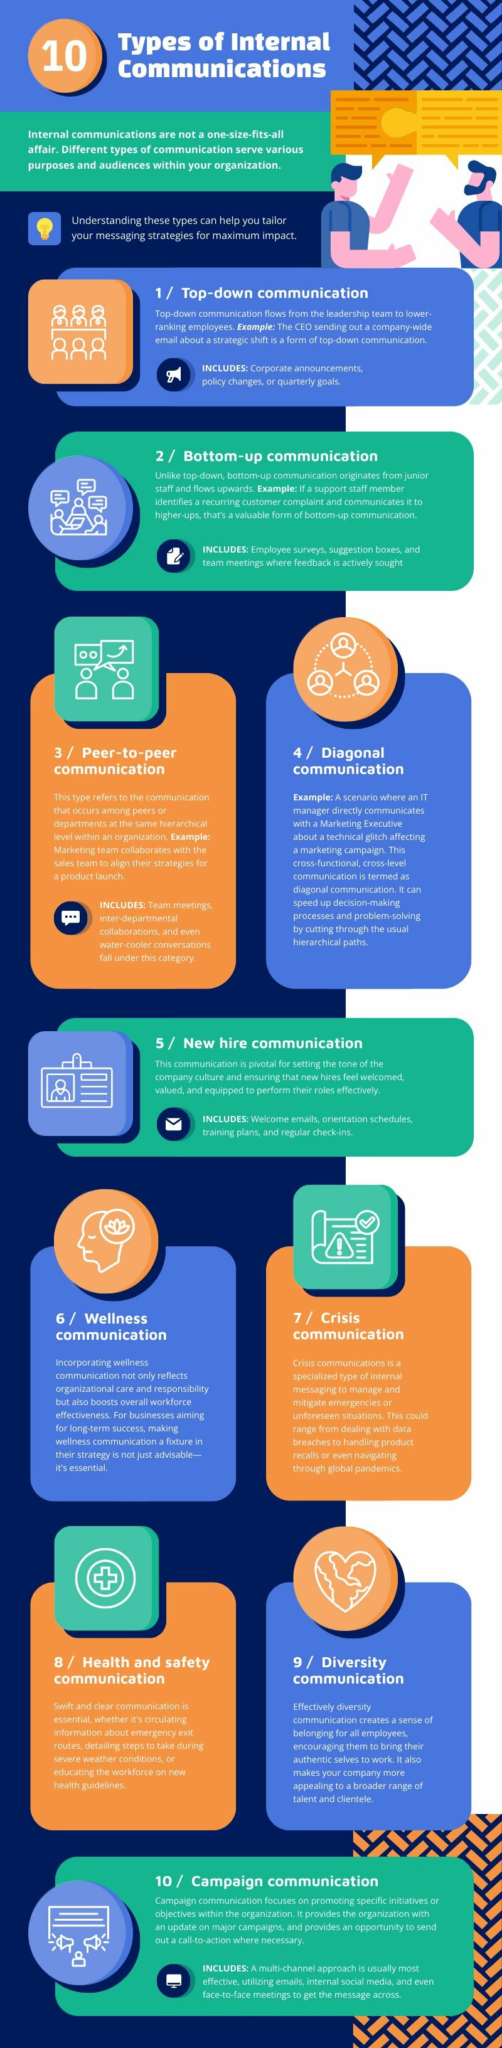
Types of Internal Communications
Infographics
Types of Internal Communications
 Infographics
Gallup Q12
Infographics
Gallup Q12