Customer Story
How A High School Teacher Uses Piktochart to Improve Learning in Classroom

Jamie Barkin
English and AP Literature Teacher
- Company
- Company Website
- Business TypeEducation
- LocationMaryland, United States
- Friends with PiktochartSince 2016
Educators are constantly innovating new educational methods to improve learning. Over the years, visual learning has proven to be one effective method to enhance learning.
As part of our #PiktoChat series, Wilson had a brief chat with Jamie Barkin, an English and AP Literature teacher at Wheaton High School. Jamie shares how Piktochart helps her improve learning in her classroom for her students.
WM (00:07):
Hello everyone, I hope you are well out there and thank you for tuning in to our #PiktoChat series. My name is Wilson and I’m a project specialist with Piktochart, and I’ll be your host for today’s #PiktoChat. #PiktoChat is a series of chat with leaders and entrepreneurs to share their knowledge and experience in using Piktochart.
Today, I’m delighted to be joined by Jamie Barkin, a high school English and AP Literature teacher at Wheaton High School. Jamie is an avid user of Piktochart since 2016 and I’m excited to be speaking with her today. Hello, Jamie. Welcome to our #PiktoChat. How are you doing over there?
JB (00:38):
Hey Wilson. Thanks so much for having me. I’m doing great today. How are you?
WM (00:42):
I’m doing well. It’s such a delight to have you here with us today. I’m so excited to be speaking with you. But before we begin our #PiktoChat, I’m sure our audience would love to know you better. So perhaps you could introduce yourself further and let us know how you got started in the education field and what led to your role today at Wheaton High School?
JB (01:00):
Absolutely. So I started student teaching in 2015. I had worked in marketing for a big corporate company, a major insurance company and so I understood how important visuals were. I also have ADHD so I’m a very visual learner and when I discovered Piktochart through my mentor teacher who used it, he introduced it to students actually to use, I was really struck by just how seamless everything looked. I mean, he had 9th graders putting together these presentations that looked like Ted Talks.
So I started using them and in the time that I’ve used you guys, you have developed all kinds of new features that have just made it even more versatile and better for me to use in my classroom. I started teaching at Wheaton High School, which is in Maryland back in 2016, and my kids have always commented on my slides and so have my colleagues. So Piktochart has just sort of become a natural part of what I do because the response has always been positive.
Jamie Barkin, English and AP Literature teacher at Wheaton High School“Piktochart has just sort of become a natural part of what I do because the response has always been positive.”
WM (02:02):
Thanks for being such an advocate of Piktochart. And of course, I’d love to also share your website (Ms. B’s Piktochart Presentations & Resources) that you share with us and our audience, so we’ll leave that for you to check it out. Go and check out Jamie’s work because it’s amazing what she’s doing in her class through Piktochart.
Well, that’s incredible and I’m curious to also know this question. You mentioned it a bit, but how did you first discover Piktochart? Was it back in 2016?
JB (02:28):
It was between 2015 and 2016. So we had a specific AP class that I was observing and these kids do a research project for the whole year and they had to create infographics. And really, when you think about software that’s free and online that allows you to create infographics, there’s not a lot. I mean, now there’s a couple of sites but back then, it was really just Google Slides, which you can’t make a good-looking infographic on a Google slide. You can’t. The format doesn’t work.
Where Piktochart had the ability to change the size of the blocks. It had the ability to manipulate things in ways where they could really make it their own. But it also had a template they could work from, so you’re not asking a 16-year-old kid to put something together that looks really professional. So I discovered it then and I’ve pretty much been hooked ever since.
Jamie Barkin, English and AP Literature teacher at Wheaton High School“When you think about software that’s free and online that allows you to create infographics, there’s not a lot. I mean, now there’s a couple of sites but back then, it was really just Google Slides, which you can’t make a good-looking infographic on a Google slide. You can’t. The format doesn’t work.”
WM (03:23)
I love your story and how you got started with Piktochart. Well, you’re an educator yourself and I’d like to know this, why do you think visual communication is so important in your field in education?
JB (03:34):
Oftentimes with education, we talked about how there are different types of learners and we know that. Research has proven that. Well, I have like I said ADHD. I was an easily distracted kid. I’m very visual. If something is visually engaging, I will pay attention and I realized if I make these slides look really cool or if I theme them, then at least if they’re getting distracted, it’s with the material for class.
So that was kind of where I started with it. Let’s see what happens and it’s so much more engaging to look at something that’s fun to look at. It really is. It has made a huge difference in that regard I think for kids, it just gets that buy-in where they’re like, “This is cool. All right, let’s see what this is.”
WM (04:18):
I can definitely relate to that because I remember even back in college when I see a beautiful presentation by one of my educators, I’m struck in awe by it like, “I want to hear from you.” I totally can see why you’re saying that.
So you’ve been using Piktochart since 2016. Perhaps you can also share with us how has Piktochart or visual communication in general benefited your work at Wheaton High School?
JB (04:44):
What it has really done, I think in a lot of my classes because I teach 9th graders and 12th graders. When there are more difficult concepts or when we’re doing something that’s just not that interesting like they’re taking notes, it gets the kids to stay more engaged for a longer period of time. Plus with the way you all have your interface set up, I can hyperlink things, I can make things function in different ways.
So even if I’m not there, even if I have a substitute, everything that they need can be in one infographic. And I actually have used that a lot when I’m out for sickness and things like that. I can just put everything in an infographic from Piktochart and the kids are able to access it all. And again, it’s an easy visual path to follow and I think that’s important.
Jamie Barkin, English and AP Literature teacher at Wheaton High School“I can just put everything in an infographic from Piktochart and the kids are able to access it all.”
WM (05:31):
When you’re mentioning that, it means you share the link of the infographic with them, is that correct? So that they can access it. That’s brilliant! It’s amazing to see how you’re using that.
Well, I’m sure you’ve created a lot of visuals using Piktochart. I’ve seen it on your website as well. But if you can narrow it down, what do you think is perhaps your most successful or your most proudest creation with Piktochart?
JB (05:54):
There are a couple of different ones that I’ve made, where I took templates that you all had or I was somehow inspired by things that you had put together and then significantly altered them or if I needed like extra slides, I would take that background and that template that you used and then go on a website and find like a PNG and drop it in. So I’ve made ones that are like Little Red Riding Hood theme and fairy tale theme. And that’s what I love and you all have the animated graphics. You have the black and white ones. You have color ones. I can do pretty much anything I need to do. So that’s a really hard question, Wilson.
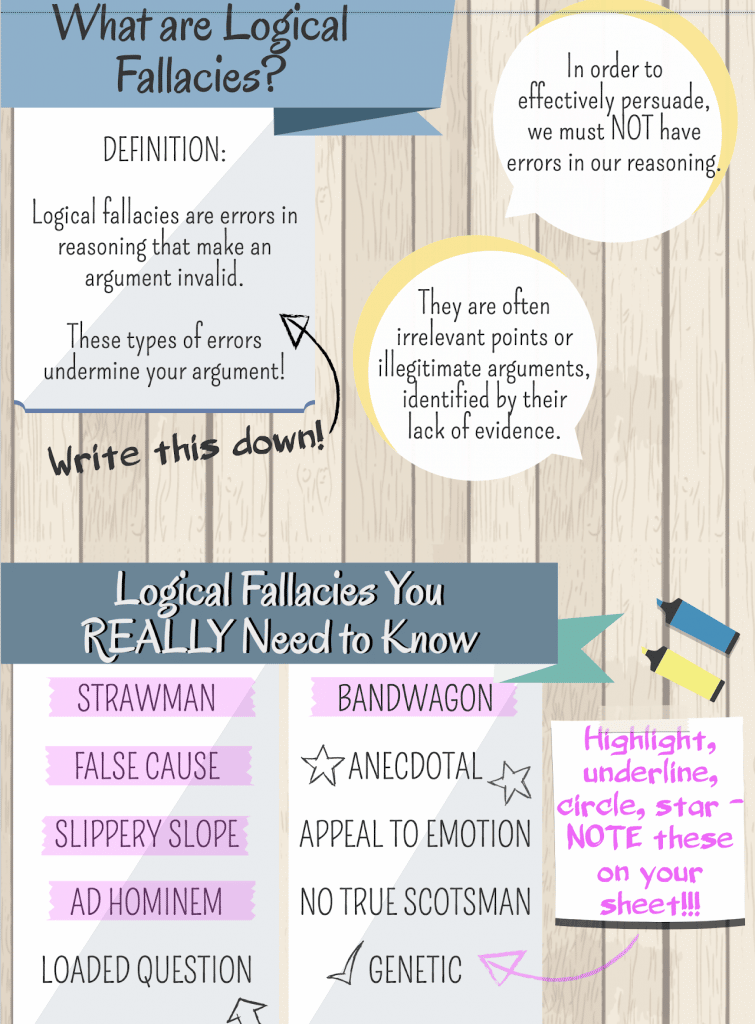
The one that’s probably been the most successful for me is I had a lesson that I did on logical fallacies which for the freshman can be a very difficult topic but it was easier for them to understand because I could quite literally format it like a notebook because of the templates and then they’d know exactly what to write down. Frankly, for me, that’s been the easiest because kids who don’t know how to take notes, it’s right there. They know exactly what to write down.
Jamie Barkin, English and AP Literature teacher at Wheaton High School“I can do pretty much anything I need to do with Piktochart.”
WM (07:07):
It’s interesting to see how you’re using that and I love how you share that you also kind of mix and have the flexibility to create. That’s what we want to do in Piktochart. We just want to inspire you all to be able to be creative. So it’s not too rigid by just using a template. You can also start from a blank template, if you’re inspired by somewhere else.
Well, thank you for sharing that and what you’ve done with Piktochart. I also would like to hear from you because you’ve been using Piktochart for many years and you’ve tapped into the power of visual communication as an educator yourself. So if you are speaking to an educator today and you could offer them the three most important tips, what would you give to them?
JB (07:44):
What I would say is one – be as clear as possible. Two – never be afraid that you are this is specifically with teachers, never be afraid that you are over-explaining. On a lot of my slides, I will actually use a font that looks like handwriting and that doodle arrow that you all have (the icon) and I’ll put, “Write this down” on a slide so they know exactly what to write. And my last piece of advice would be to recognize the power in letting the kids see a bit of who you are through those visuals. Make visuals that are about things- that you like and that you enjoy, and let them see that piece of you through it.
WM (08:25):
I like the second tip you mentioned, which is to over-communicate. I think it’s so important in this time and age. So finally to wrap up, just a quick one is also would you mind sharing with us what is your favorite feature about Piktochart?
JB (08:39):
I really like how you can manipulate the formats. Like I could start with an infographic and I can make it slide size if I need to alter it because that’s not something that a lot of other software offers. A lot of the time if you’ve started down one road, you’re sort of boxed in whereas with Piktochart, I can immediately just go to customize, change the size of the blocks and then all of a sudden, it’s exactly what I needed. I love that.
Jamie Barkin, English and AP Literature teacher at Wheaton High School“A lot of the time if you’ve started down one road, you’re sort of boxed in whereas with Piktochart, I can immediately just go to customize, change the size of the blocks and then all of a sudden, it’s exactly what I needed. I love that.”
WM (09:07):
So customization is perhaps one of your top features about Piktochart.
JB (09:11):
For sure and admittedly, there’s one feature I want to use, but I haven’t yet because one of my close girlfriends, who’s also a colleague of mine doesn’t work in my school anymore. I want to use the Teams feature where we can work on the same document at the same time. So yes, I have to test that one out because that’s a newer feature and I’m really excited about it.
WM (09:31):
I hope you enjoy that. If you’ve used Google Drive, you kind of know how it works. We’re just bringing it into visual communication and we’ve seen teams using it and it has been so effective for them.
JB (09:41):
Well, I can have my students use it too.
WM (09:43):
Yes, if they can leave a comment on a particular part of it, ask you any questions and also they can tag one another so that could be a helpful one. It was truly a pleasure to be speaking with you in this #PiktoChat, Jamie. Thank you for sharing your inspiring story with us today and also for being such a great advocate of Piktochart and visual communication in the education field.
If you’re listening to this and would like to get connected with Jamie or myself, feel free to connect with us on LinkedIn. If you’ve enjoyed this episode, we have many other episodes from leaders and entrepreneurs who share their inspiring stories with us, so feel free to check that out as well. That’s the end of our #PiktoChat today and goodbye.
Infographic Templates Recommended for Educators


Ready to create an impressive infographic?
Join more than 11 million people who already use Piktochart to craft amazing visual stories.
More stories
Lorraine Thomas
Family Support Specialist at Holland Bloorview Kids Rehabilitation Hospital
As an advocate of health literacy, Lorraine shares how Piktochart helps her to educate her patients
Read StoryDeborah Tan-Pink
Senior Communications Manager at Revolut
A longtime customer of Piktochart since 2013 shares how she uses Piktochart throughout her career
Read StoryTheodore Paat
Instructional Designer at Affirm
Theo did a lot of research for various platforms ranging from Venngage to Canva. Find out why he decided for Piktochart.
Read Story