Customer Story

How An IT & Management Solutions Firm Win Clients With Piktochart

Lloyd Parker

Vice President Programs & Solutions

How can an IT and management solutions firm incorporate visual communication in their work? As part of our #PiktoChat series, Wilson had a brief chat with Lloyd Parker, Vice President of Programs & Solutions with T. White Parker Associates, an IT and management solutions firm.

Lloyd is an executive and partner at T. White Parker Associates and he oversees program operations, client engagement, service delivery, solutions and strategy, and P&L for their client base.

As a Piktochart user since 2021, Lloyd shares how Piktochart has helped his firm to convince and win clients. The use of visual communication has benefited his firm in helping them stand out among its competitors and gain its clients’ trust.

WM (00:06):

Hello everyone. I hope you’re well out there and thank you for tuning in to our #PiktoChat series today. My name is Wilson and I’ll be your host. If this is your first time listening to us, #PiktoChat is a series of chats with leaders and entrepreneurs who share their knowledge and experience in using Piktochart.

Today, I’m delighted to be joined by Lloyd Parker, Vice President of T. White Parker Associates, and IT and management solutions firm. Lloyd is an executive and partner at T. White Parker Associates and he oversees program operations, client engagement, service delivery, solutions and strategy as well as P&L for their client base. Lloyd has been using Piktochart since 2021 and it’s my privilege to be speaking with him today.

Hello Lloyd and welcome to our #PiktoChat. How’s it going over there for you?

LP (00:50):

Wilson, good morning. It’s great on my end. Thank you. Glad to be here with you.

WM (00:54):

Firstly, thank you for making time for coming on this #PiktoChat and I’m excited to be hearing your story.

Before we begin, I’m sure our listeners would love to know you better. So would you like to introduce yourself further and let us know how you got started in your professional career and what led to your current role?

LP (01:11):

My name is Lloyd Parker. I’ve been working professionally for pretty much 30 years. I have a Bachelor’s degree in computer information systems. I also have a Master’s degree in electrical engineering. I spent a lot of my career doing systems engineering related work, big enterprise, federal systems. Some commercial work. Went from that, I’d spent a period of time in human capital. So I did some work in HR and eventually got to T. White Parker. It’s actually a company that I run with my wife. She started it. She’s primarily a business IT architect type of person. So her skills, she had started. I came over and joined her in 2009.

Since that time, I’ve been working here. Lots of presentations. Lots of executive communications. Lots of document writing and such. That’s all been a part of what I do. And so, Piktochart really came into focus for me. One of our employees, quite honestly, he had a presentation that we’d asked of him and it looked phenomenal and we said, “Hey, how did you do that?” He said, “Oh, I use something called Piktochart.”

I am a very creative person but I’m by far not a graphic artist. I’m not trained in any of that. And so I was familiar with PowerPoint and sort of embellishing PowerPoint with Adobe Illustrator. I had started to dabble there. I definitely am nowhere near an expert. I mean no one would want to pay for the things that I could create, but I was serviceable. I could come up with things that works for us, but not being a formal graphic artist, it was a challenge.

I never been formally trained in Ai and so I used a lot of web videos and things and looked at what other people were doing. And when I needed something, I would create sort of go and look at a model, get a video and try to emulate what I saw it. So that’s how I was living, but it was very complex and it took a lot of time. It wasn’t all creative time. It was a lot of trying to figure out how to use the tool time.

And so that’s what got me to Piktochart. And since then, it’s been really a wonderful experience for me. In fact, people are blown away at the things that I produce now and they’re like, “Lloyd is an expert. If you wanted something to look good, give it to him.” But all I was really doing was taking some of the things that were already out there that you guys had and I’d change colors. I’d put some of the graphic and things into it, but I’ve gotten more advanced with it.

And now I’m creating some of my own graphics, which has been great and that even works well. So it’s exciting. And when I saw your invitation, I mean, I was like, absolutely. This has really changed the way that we look and operate as a business and being a small firm, we’re competing in spaces with some of the big time professional firms who have full out graphic shops. And what we can produce now rivals what they produce. And so it looks like I’ve got a whole team of people behind me but I really don’t. So it’s kind of my best kept secret.

“Piktochart has really changed the way that we look and operate as a business and being a small firm, we’re competing in spaces with some of the big time professional firms who have full out graphic shops. And what we can produce now rivals what they produce. Piktochart is kind of my best kept secret.”

Lloyd Parker, Vice President Programs & Solutions at T. White Parker Associates

WM (03:59):

That’s amazing and thank you so much for sharing that. It’s so encouraging to be able to hear especially from you and hearing like real life examples of how people are finding Piktochart beneficial for their firm. I echoed what you say that especially in a small team and I think that was also what a lot of Piktochart users are from. You don’t have like a team of graphic designers doing it for them. But with the tool, they are able to do that.

So thank you so much for giving us an insight on that. I think that also answers the first question that I was going to ask you, which is how did you first discover Piktochart? So you mentioned it was through one of your employees, correct?

LP (04:35):

Correct. And at the time, we saw it and we were impressed. It kind of stuck in my mind that that’s what he told me he used. But I didn’t really go out until a few months beyond that when I needed to try something to see what I thought. And I used the free option just to see and I love what I could do and how quickly I could do it. And so did the people I was doing it for.

Then I said, I’m definitely going to go full out on this and went ahead and paid for the subscription because I knew I was going to need more than five and I’ve probably done maybe somewhere close to 30 or 40 different graphic presentations through the system. So I’ve done everything. I mean, I’ve done infographics. I’ve done PowerPoint presentations. I’ve done flyers. I’ve done programs. Now into my personal life as well. I mean, I use it for all sorts of things.

WM (05:19):

That’s great to hear. Well thank you so much for being an advocate of Piktochart and also for supporting us by subscribing to a paid account. We really appreciate it.

Let’s get our conversation going. Now we talked a little bit about your role in IT management. Can you let us know why is visual communication so important for your role in your industry?

LP (05:38):

Our firm, T. White Parker is a management consulting and IT solutions firm. And so we do quite a bit of work with leaders across our different client base. When you’re dealing with leaders, you often have to communicate through presentations. It really is a sort of an express way of conveying ideas and thoughts when they don’t have the time to read long lengthy documents and that sort of thing.

So, presentations have always been a mainstay for us. In fact, as we hire people, we always say, being able to present is one of the key capabilities that you have to have in order to be effective in the role. And so it’s always been there. Graphics has always been a main piece of it and in fact, tables and charts and things like that, it just goes hand-in-hand. The more you can infuse some of these innovative ways of showing the data, it really helps you just sell the idea that you’re trying to convey.

“Graphics has always been a main piece of it and in fact, tables and charts and things like that, it just goes hand-in-hand. The more you can infuse some of these innovative ways of showing the data, it really helps you just sell the idea that you’re trying to convey.”

Lloyd Parker, Vice President Programs & Solutions at T. White Parker Associates

And so for us, making it look a certain way really instills a confidence from the receiver so that they know this clearly must be information I should take seriously because they took the time to put it into this format. It changed the nature of how we communicate and made the messages a lot more impactful. So that’s really been our experience and it’s come to be something people expect from us.

Now people are saying, give T. White Parker your charts if you want to make sure that they look good and you want to make sure that the messages are there so I can focus a lot more of my energy on the messages that we’re giving. Not so much on creating the visuals to go along with it. That’s much more simplified.

WM (07:10):

Yeah, I really appreciate your input there when you mentioned about how your design helps to convince people and help to sell your idea better as well. That’s great to be able to see visuals playing such a big part even in convincing your clients and stakeholders about the message that you’re intending to communicate to them.

Thank you for giving us an insight especially on that role in terms of IT and management. Now, you’ve been using Piktochart since 2021. Just now you touched a little bit about this but I know that you mentioned that prior to using Piktochart, you have used a combination of other tools to create graphics.

So how has Piktochart or visual communication benefited your firm or your career in general? Can you share more about that with us?

FP (07:49):

Yeah, we do federal consulting. So for the government, there’s always proposals that we have to submit to bid for work. And so the quality of what we’re able to produce in our proposals has improved. The things that we do on each of our engagements has gotten stronger In fact, I personally support each of our engagements graphically so I do graphics to support everybody.

And so everyone’s benefited from the high-end looking professional graphics that we’re producing, but more importantly, I would say, we were paying a lot of money to get this caliber of graphic support prior. We would have to pay thousands of dollars to custom firms that were able to go out and do above my level in Adobe Illustrator. When we really needed something to look really, really polish, we had to pay and it wasn’t cheap to get these folks to do this kind of thing.

So now we’ve eliminated all that cost and a fraction of the time I’m able to take the idea and the interesting thing is it was always my idea going to these other folks and they were now going in. We go back and forth a few times and then they would come up with something. Always look wonderful, but it was still my original idea. Now, I can take my own idea and I can go look for things that maybe you guys have. I can pull elements from various graphics together. I can add some additional elements. I can color it the way I want. I can put the words on it the way I want.

So I’m able to do in a fraction of the time and it actually has become part of my idea creation process. As I’m looking for ideas, I may look through some things you guys have to see what kind of hits me and gives me the idea of where to go and then I can use that as sort of my launching point to get started.

“We were paying a lot of money to get this caliber of graphic support prior to Piktochart. Now we’ve eliminated all that cost and a fraction of the time.”

Lloyd Parker, Vice President Programs & Solutions at T. White Parker Associates

WM (09:25):

I loved hearing that and also how it has helped you to save cost and also time, and I think making you independent where you’re able to design your own stuff and you actually know what you’re designing. I think also gives you a sense of pride like this is my work, I didn’t pay someone to do it and you can tell your clients about that.

FP (09:42):

That’s exactly right.

WM (09:44):

You mentioned that you’ve created about like 30 to 40 visuals, which is a lot. Now out of all of those visuals, is there a particular one that you find it most successful for you, something that you’re most proud of among all the visuals?

FP (09:55):

I could probably answer that two ways. I mean there’s probably one visual that at least the firm has really embraced and they love. It’s become sort of a mainstay for conveying what we do and what we’re all about. That visual is sort of a combination. You all had a, I think it was meant to be some type of, it was like an oval type of graphic and in that oval, you had done some things and I think it was like a flyer but I took it and use it as sort of a business process and then I overlaid a white center on it.

And now I’ve got some icons around it to sort of make it sort of like an infographic but it really conveys the nucleus of how we do program management. We call it program 360 so it’s a way of looking at all elements of how you do program management. It’s what we use for all our clients and it’s in all our proposals. And it’s really started to be something that people really want to know more about. So it’s become a major marketing tool for us.

That’s probably our most successful graphic, but for me, probably the greatest graphic that I ever did was probably an infographic. It was my first attempt at one. It had reddish and bluish color in it. It sort of overlaid with some designs and different things and it was for a railroad company. And so I brought in a lot of different railroad and train images and such.

It was such a powerful graphic that they wanted to know how much we pay because they hadn’t asked for it. And I said, “Don’t worry, we developed it ourselves.” And they were like, “Wow, we didn’t know you guys had that capability.” So I was able to surprise a lot of people with something that looked like it cost a lot of money but it really was a simple graphic that I had pulled together and created right in the tool.

“I was able to surprise a lot of people with something that looked like it cost a lot of money but it really was a simple graphic that I had pulled together and created right in Piktochart.”

Lloyd Parker, Vice President Programs & Solutions at T. White Parker Associates

WM (11:28):

Yeah, that’s impressive to hear and I love how you can also take different elements from different templates and make it your own. So it doesn’t just look like one of the Piktochart template. I’m glad that you can find inspiration and different elements that could actually work for your business proposal and for your use case. Thank you for sharing that. I’m so impressed to hear that and also hearing from you is so encouraging.

Now, based on your experience of using Piktochart over the past year and if you could offer three most important visual communication tips for anyone who’s listening to this, what would that be?

LP (12:00):

So, I would say by far to start off with graphics that are there. There are a ton of different already created graphics that you can take and look at to see. Sort of start there to get your ideas. Once you have your ideas, everything you see can be modified so you can change colors. You can change positioning. You can really customize it from their template and make it your own. Not to try to be someone that you’re not. Take advantage of what’s there.

You can usually find something that will get the job done for you and then you can just customize it. But as you do more and more of that, don’t be afraid to try the original blank canvas and try to create some things on your own and see how it goes. For me, I kind of actually start from a blank canvas now because there’s so many things that I can do. I just go grab icons and images and I can pretty much bring in all the other elements that I know that I want.

And if I get stuck, then I go look at the templates and kind of say, what’s another way that I may be able to do that and then if I see something, I can replicate it now. I’ve gotten to the point where I’m able to do in Piktochart now the things that I would originally try to do in Adobe Illustrator but I can do them much more quickly and I kind of feel like I’m almost an expert in being able to do what I want to do. I don’t have a concern that I’m not going to be successful. I already go into it knowing that I know this is going to end up looking like something that’s really, really nice and I have a confidence there.

“I’ve gotten to the point where I’m able to do in Piktochart now the things that I would originally try to do in Adobe Illustrator but I can do them much more quickly and I kind of feel like I’m almost an expert in being able to do what I want to do. I don’t have a concern that I’m not going to be successful.”

Lloyd Parker, Vice President Programs & Solutions at T. White Parker Associates

So to me, that’s my recommendation. Start off with the templates. Use what you see. Customize color and not play around too much with the graphics. As you get more comfortable and it won’t take long, begin to branch out into the blank canvas and see what you can do. You’ll be amazed. You’ll become an expert real quick.

WM (13:37):

Those are really great tips. I love how you also mention that after trying with the templates and stuff, you should start creating on your own. I think that’s where your own creativity flows instead of relying on our templates. I think that’s our goal as well, which is to unlock the graphic designer in us. Making everyone look like professionals. So I’m glad to hear that the tool has been helpful for you in that case.

To wrap up, my last question for you is this, what is your favorite feature about Piktochart?

LP (14:03):

I would say the tool continues to add new things. There’s a new series of graphic elements. They are like already made. They almost look like animation type of graphics. I’ve really enjoyed the icon builder too because when you’re looking at creating infographic type of things and using icons that you can color however you want to, it really allows you to quickly come up with something that works.

So for me, I go into the graphics mode and then I go into icons and I usually get the majority of my content right from there. I’ve really loved how there’s so many things to choose from. I pretty much don’t need to go outside the tool to find any type of icon. For me, that’s been by far the most powerful feature. It’s really helped cut the time it takes for me to develop the things that I develop.

WM (14:48):

That’s awesome to hear. Icons and illustrations are also one of my favorite features about Piktochart. I think there’s just so much in there and also we have a collaboration with IconScout, so you can find all of those icons on Piktochart for free. It’s great to hear that it’s helpful for you.

Well, thank you so much for making time to speak with us, Lloyd. It was a pleasure and it’s inspiring to hear your story in this #PiktoChat. We’re grateful to have you advocating for Piktochart and also visual communication. For those of you who are listening, if you’d like to get connected with Lloyd or myself, feel free to connect with us on LinkedIn.

If you’ve enjoyed this #PiktoChat episode, feel free to check out the rest of our episodes to hear more inspiring stories from leaders and entrepreneurs. That’s the end of our #PiktoChat today and until the next one.

Infographic Templates Recommended for Consultants

International Women’s Day Infographic Infographics International Women’s Day Infographic
Tips for Improving Employee Engagement Infographics Tips for Improving Employee Engagement
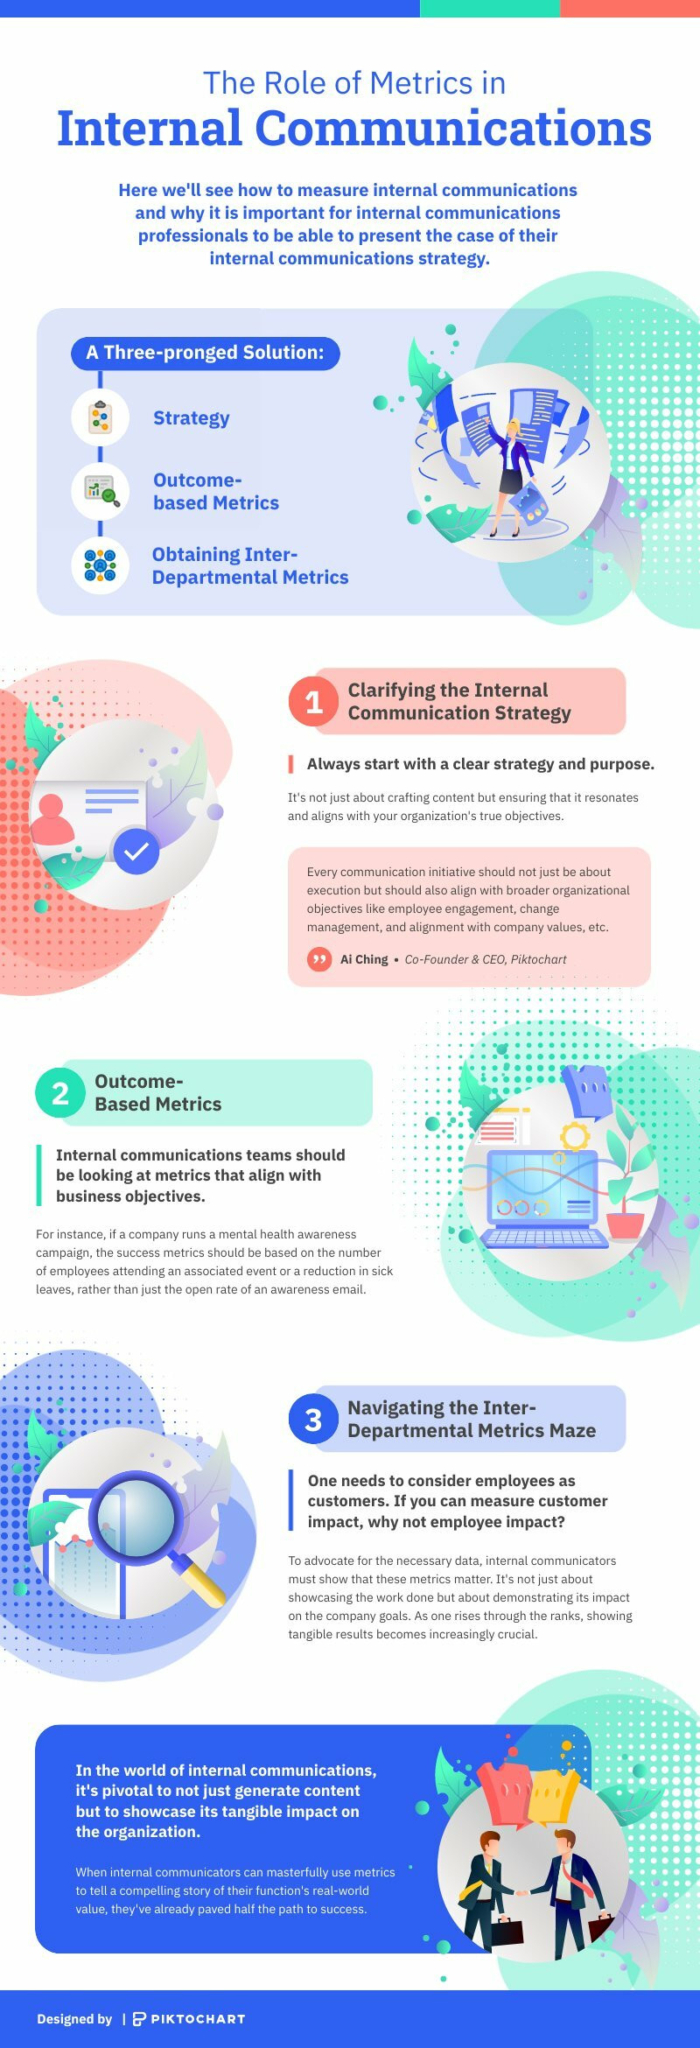
The Role Of Metrics In Internal Communications Infographics The Role Of Metrics In Internal Communications
Black Historical Figures Infographic Infographics Black Historical Figures Infographic
Facts About Women’s History Month Infographics Facts About Women’s History Month
History of Black History Month Infographic Infographics History of Black History Month Infographic
Explore more infographic templates

Ready to create an impressive infographic?

Join more than 11 million people who already use Piktochart to craft amazing visual stories.

More stories

Jesse Stringer

How a Government Research Analyst Presents Data Effectively With Piktochart

As a research analyst with the government of Alaska, Jesse shares how Piktochart has helped him to present data effectively.

Read Story

Deborah Tan-Pink

Senior Communications Manager at Revolut

A longtime customer of Piktochart since 2013 shares how she uses Piktochart throughout her career

Read Story

Anne Payuan

Co-Founder at The Bright Millennial

The ease of use of Piktochart helped Anne scale her digital marketing agency.

Read Story